How Can We Help You?

Sector and market analytics

Driven by economists and leveraged by market makers.
CRE performance across major metros and asset classes. History and forecast by CBRE.

Thought leaders abound

Depth, breadth and rigor concentrated at all levels.
Synthesizing macro factors and leading indicators into actionable national, sector and market research.

Advantage is CBRE

Perspectives, scale and connections that work.
Commercial and cultural insight aligned with intellectual capital and experience to fuel informed real estate decision-making.

Which data are right for you?

Data views and extracts by scenario and on demand.
Check out the fundamentals, capital markets, and data tools now on our one-pager.

Experience the platform

See first hand why top institutional investors, direct lenders and private equity firms are clients.
Set a time that works for you.

Click the link above to access all EA Insights

Apartments: Are development trends hurting the new and the high-end?

May 24, 2017, 23:46 PM by User Not Found

When I’m asked where we are in the multifamily cycle, two things come to mind. First, that the particular market matters: not all are moving in the same direction—some are slowing while others are still accelerating. Second, the type of asset we’re considering matters. Recent development trends have been focused squarely on raising high-end product in centers of economic vibrancy (i.e., urban cores and high-density, suburban, Live-Work-Play environments).

With many markets pushing toward a peak in this development cycle, we suspected that development and macro trends might be lowering the performance of, and creating downside risk for, newer, high-end apartment assets. So we looked to the data for an understanding of performance across cohorts of asset vintages.

We looked at rent growth, occupancy and concessions. Here’s what we found:

Concessions figures remain relatively low, and there isn’t much of a difference between newer assets and older ones. Part of the reason for this is that data providers are having difficulty tracking non-traditional concessions like gift cards, gym memberships, free parking, etc.

Somewhat surprisingly, nor are there compelling differences in occupancy rates.

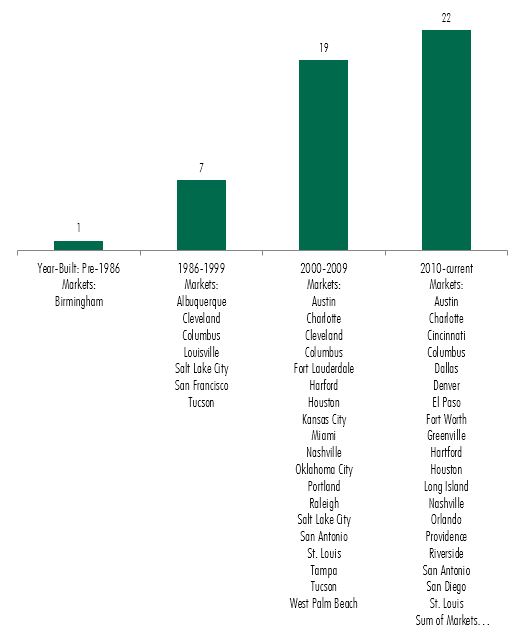
Through the lens of effective rent growth, however, the story becomes more interesting. In many markets with mature development pipelines, effective rent growth among newer assets is decelerating significantly—particularly versus these markets’ respective averages. Twenty-two the 62 markets that CBRE EA tracks (and the Sum of Markets) have seen average rent growth among newer assets (those built since 2010) at 200 basis points (bps) or more below respective market averages. For assets built between 2000 and 2009, that count was 19.[1]

Figure 1. Markets whose Average Effective Rent Growth Exceeds that of the Specified Vintage by at least 200 bps

Below-Average Rent Growth, by Vintage - Number of markets


Source: Axiometrics Inc., CBRE EA; Q1 2017.

The trend is most notable in Austin, Dallas, Denver, Houston, Miami, Nashville, Orlando, Portland, Raleigh and the Sum of Markets. All are showing softness in newer assets. This information implies something about the performance of older assets, however: they must be outperforming their respective market averages in order to offset the underperformance of newer assets.

Interestingly, we don’t see the Bay Area (San Francisco, San Jose and Oakland) or New York City in these lists (with the exception of San Francisco assets built between 1986 and 1999)—despite their overall sluggish (and even negative) rent growth of recent quarters. The reason is that rents in these markets are falling across the board.


[1] Because quarterly data can be noisy—especially when broken down by market and by vintage—we examine trends using 4-quarter trailing averages.


Ready to Get Started?

60 second demos.


WATCH NOW

Experience the platform.


TRY IT TODAY

Become a client.


NEXT STEPS
redirect pin user minus plus fax mobile-phone office-phone data envelope globe outlook retail close line-arrow-down solid-triangle-down facebook globe2 google hamburger line-arrow-left solid-triangle-left linkedin play-btn line-arrow-right solid-triangle-right search twitter line-arrow-up solid-triangle-up calendar globe-americas globe-apac globe-emea external-link music picture paper pictures play gallery download rss-feed vcard