How Can We Help You?

Sector and market analytics

Driven by economists and leveraged by market makers.
CRE performance across major metros and asset classes. History and forecast by CBRE.

Thought leaders abound

Depth, breadth and rigor concentrated at all levels.
Synthesizing macro factors and leading indicators into actionable national, sector and market research.

Advantage is CBRE

Perspectives, scale and connections that work.
Commercial and cultural insight aligned with intellectual capital and experience to fuel informed real estate decision-making.

Which data are right for you?

Data views and extracts by scenario and on demand.
Check out the fundamentals, capital markets, and data tools now on our one-pager.

Experience the platform

See first hand why top institutional investors, direct lenders and private equity firms are clients.
Set a time that works for you.

Click the link above to access all EA Insights

Addressing recent discrepancies in the industrial TW Rent Index

Jan 15, 2018, 14:08 PM by User Not Found

Our most recent forecast release (Q3 2017) had the Industrial TW Rent Index at $6.14 per sq. ft. in Q2 2017, up 5.1% on the year. That figure was materially different from the Q2 value in our previous (Q2) release ($6.31; up 6.2% on the year). The source of the difference was our re-calibration of the historical rent growth for nine markets—Cleveland, Detroit, Ft. Lauderdale, Ft. Worth, Miami, Orange County, Seattle, Tampa, and West Palm Beach—that collectively account for 17.3% of the Sum of Markets stock.

Why was it necessary to re-calibrate historical rent growth for these nine markets?

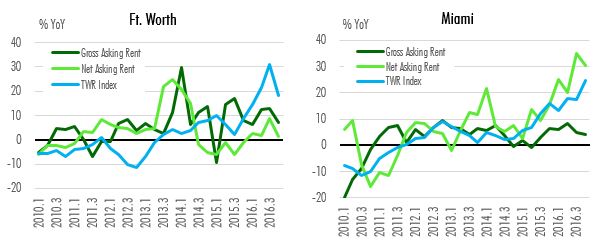
At EA, we essentially forecast rent growth, from which we then derive forecast levels. Let me take Fort Worth and Miami as examples. Looking at the Q2 forecasts, it was apparent that the year-on-year growth in the TW Rent Index was not accurately reflecting the underlying market conditions for Miami, nor for Fort Worth, and hadn’t been for quite some time.

Gross/Net Asking Rents vs. TW Rent Index

IND Rent Index Discrepancies Q3 2017 - Fig 1

Source: CBRE Econometric Advisors, Q3 2017.

In Ft. Worth, most of the market quotes a net asking rent. Comparing year-over-year growth in net asking rents with year-over-year growth in the TW Rent Index (which is an effective rent), there’s nothing to support or explain the index growing at double-digit rates for a sustained period (Q1 2016 to Q2 2017).

In Miami, much of the market quotes a gross asking rent. As for Ft. Worth, the rent index for Miami shows particularly strong year-over-year growth for an extended period (Q3 2015 through Q2 2017). With year-over-year growth numbers for gross asking rents not nearly as strong as those for the TW Rent Index, the data suggest that rent growth dynamics are a lot more modest.

Here is a spreadsheet comparing Q2 and Q3 for year-over-year growth in the TW Rent Index (i.e., before and after calibration for the nine markets [columns G & H]). Note that the year-over-year rent growth and rent levels are now more defensible.

As mentioned earlier, the nine markets with revisions make up 17.3% of the Sum of Markets stock. Bear in mind that the Sum of Markets rent level is a stock-weighted average of the individual rent indices for EA’s 51 Tier 1 metros. Since rent growth—and consequently rent levels—were revised down (in varying degrees) for 17.3% of the total industrial stock (i.e. the nine markets), rent levels for the Sum of Markets had to come down as well. The Q3 rent growth figure for the Sum of Markets therefore looks materially different from its Q2 counterpart as well.

Ready to Get Started?

60 second demos.


WATCH NOW

Experience the platform.


TRY IT TODAY

Become a client.


NEXT STEPS
redirect pin user minus plus fax mobile-phone office-phone data envelope globe outlook retail close line-arrow-down solid-triangle-down facebook globe2 google hamburger line-arrow-left solid-triangle-left linkedin play-btn line-arrow-right solid-triangle-right search twitter line-arrow-up solid-triangle-up calendar globe-americas globe-apac globe-emea external-link music picture paper pictures play gallery download rss-feed vcard