How Can We Help You?

Sector and market analytics

Driven by economists and leveraged by market makers.
CRE performance across major metros and asset classes. History and forecast by CBRE.

Thought leaders abound

Depth, breadth and rigor concentrated at all levels.
Synthesizing macro factors and leading indicators into actionable national, sector and market research.

Advantage is CBRE

Perspectives, scale and connections that work.
Commercial and cultural insight aligned with intellectual capital and experience to fuel informed real estate decision-making.

Which data are right for you?

Data views and extracts by scenario and on demand.
Check out the fundamentals, capital markets, and data tools now in our brochure.

Experience the platform

See first hand why top institutional investors, direct lenders and private equity firms are clients.
Set a time that works for you.

Click the link above to access all EA Insights

Investor Sentiment Improves, Even For Class B and C Offices

May 20, 2026, 10:24 AM by Matt Mowell

By: Matt Mowell and Tyler Deckard

Investors are beginning to look a bit more favorably on the office sector, even long-shunned Class B and C commodity space.

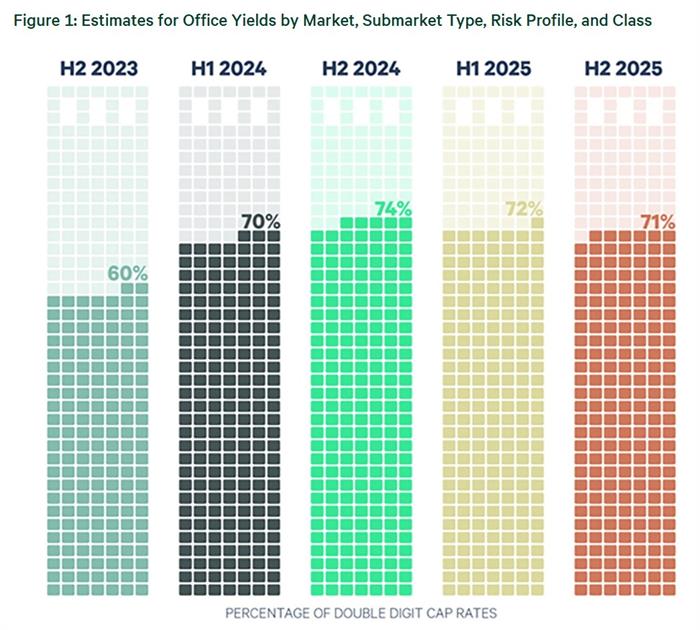
We can see this in CBRE’s biannual Cap Rate Survey (CRS)1, which provides insight into office property yields. Figure 1 shows Class B and C properties with an estimated cap rate of 10% or more. Each block represents a unique market (geographic market x submarket type x risk profile x class).

After peaking at 74% in H2 2024, the percentage of Class B and C properties with double-digit cap rates declined modestly in the two CRS surveys conducted in 2025. While it’s concerning that more than 70% of Class B and C properties still have double-digit cap rates, increased capital markets activity is enabling office valuations to find a floor, even for marginal assets. This trend is being helped along by office properties that are sold for demolition or conversion.
1 The CRS asks CBRE capital markets and valuation professionals to estimate office yields by market, submarket type, risk profile and class across 36 geographic markets.

cotmapril2026

Ready to Get Started?

60 second demos.


WATCH NOW

Experience the platform.


TRY IT TODAY
redirect pin user minus plus fax mobile-phone office-phone data envelope globe outlook retail close line-arrow-down solid-triangle-down facebook globe2 google hamburger line-arrow-left solid-triangle-left linkedin play-btn line-arrow-right solid-triangle-right search twitter line-arrow-up solid-triangle-up calendar globe-americas globe-apac globe-emea external-link music picture paper pictures play gallery download rss-feed vcard