How Can We Help You?

Sector and market analytics

Driven by economists and leveraged by market makers.
CRE performance across major metros and asset classes. History and forecast by CBRE.

Thought leaders abound

Depth, breadth and rigor concentrated at all levels.
Synthesizing macro factors and leading indicators into actionable national, sector and market research.

Advantage is CBRE

Perspectives, scale and connections that work.
Commercial and cultural insight aligned with intellectual capital and experience to fuel informed real estate decision-making.

Which data are right for you?

Data views and extracts by scenario and on demand.
Check out the fundamentals, capital markets, and data tools now on our one-pager.

Experience the platform

See first hand why top institutional investors, direct lenders and private equity firms are clients.
Set a time that works for you.

Click the link above to access all EA Insights

Higher interest rates a risk for CRE values, recession or not

Mar 8, 2017, 11:51 AM by User Not Found

With interest rates likely to increase in the medium term, what is implied for CRE and CRE values?

Running our forecasting models through two distinct macroeconomic scenarios—both involving short-to-medium term rise in interest rates—shows us how CRE asset values, as proxied by the NCREIF NPI capital appreciation return, might be affected. Our Baseline scenario calls for continued economic growth for the next two years (causing an upward adjustment in interest rates), followed by a mild recession that lasts for about two years. Meanwhile, our High Interest Rates­­ scenario sees robust economic growth over the next two years (with the attendant increases in inflation and interest rates), followed by more moderate growth.

Surprisingly, asset values are likely to drop under both scenarios. Drops would be more significant and prolonged under the Baseline, but even under a High Interest Rates scenario—where robust GDP growth would generate strong NOI income growth—rising interest rates cause modest negative value readjustment in most markets.

Let’s dive into the details:

Baseline Scenario: Moderate Growth in 2017 and a Recession in 2019

Our Q4 Baseline scenario features continuing low-to-moderate annual GDP growth of 1%-2% in 2017-2018, followed by a mild recession around early 2019. The Fed raises the short-term policy rate two or three times in 2017, on the expectation of increasing inflation. This leads to a temporary, moderate adjustment in long-term interest rates; the benchmark 10-year Treasury yield settles at around 3.4% by the beginning of 2018. Inflation picks up briefly during this period, reaching a temporary peak of 3%-3.3% during the second half of 2017.

As the recession begins in 2019, GDP growth drops slightly negative, inflation disappears, and the Fed engages in moderate easing. The 10-year Treasury yield briefly reaches 1.6% by the end of 2019. Shorter-term yields are likely to briefly dip into negative territory during that period. As the economy recovers, interest rates begin to adjust in 2020-2021 and the 10-year Treasury yield eventually reaches its long-run level of 3.5%.

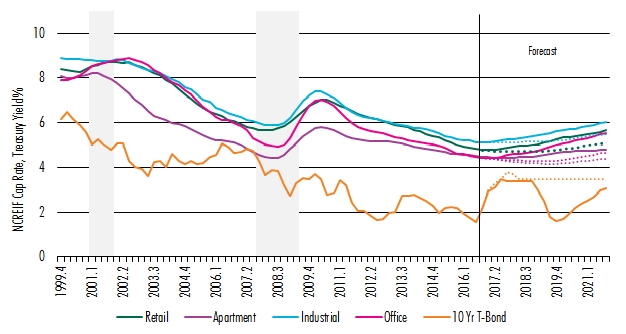
Figure 1: NCREIF NPI Capitalization Rates, National Sectors:
Baseline vs. Higher Interest Rates & Growth (Dashed)

170308 Chervachidze - Interest Rates CRE Values - Fig 1

Sources: NCREIF, CBRE Econometric Advisors Investment Outlook, Q4 2016.

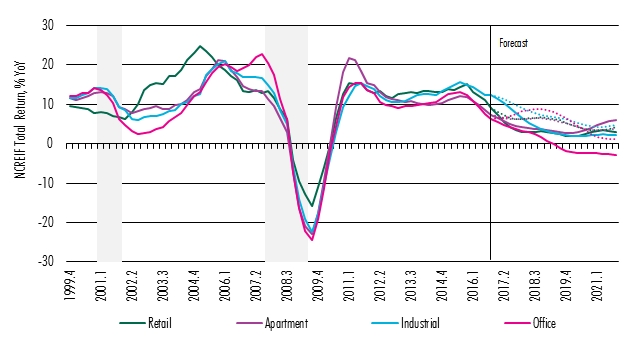
Under this scenario, cap rates begin to adjust upward by the end of 2017 and into 2018. Although these increases are mitigated to some extent by NOI growth, they put negative pressure on asset values across most markets. As recession takes hold in 2019, cap rates continue to adjust upward, working together with a lack of NOI growth (or negative growth, in some markets) to significantly depress asset values. The adjustment is moderated somewhat, however, as the Federal Reserve engages in new monetary stimulus. Total returns reach into the negative single-digits during the recession, largely due to negative appreciation returns during this period.

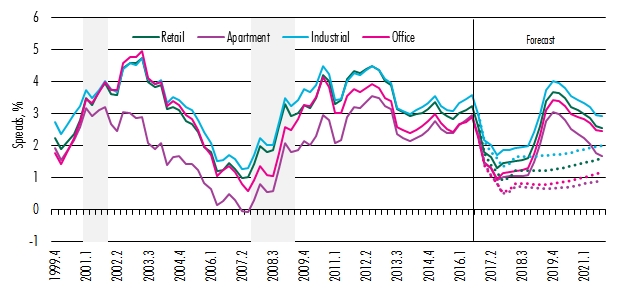
Figure 2: Spread over 10-Year Treasury Yield, NCREIF NPI Capitalization Rate, National Sectors:
Baseline vs. Higher Interest Rates & Growth (Dashed)

170308 Chervachidze - Interest Rates CRE Values - Fig 2

Sources: NCREIF, Federal Reserve, CBRE Econometric Advisors Investment Outlook, Q4 2016.

As the economy returns to growth in 2010-2021, interest rates begin to perk up, and cap rates continue to trend upward—this time due to interest rate increase brought on by the resumption of economic growth. Despite the resuming growth, asset values continue to decline (at a slower pace) for three to four years, as cap rates continue to increase and NOI growth takes a while to resume.

Alternative Scenario: High Economic Growth, then a Slowdown with High Interest Rates and Inflation

Under this scenario, the new administration enacts a tax reduction and deregulatory package (further enhanced by infrastructure spending) that leads to strong annual economic growth of 2.5%-3% for the next two years. However, the growth is accompanied by higher interest rates and increasing inflation (consistently of 2%-3%) as the Fed and market participants price in higher interest rate expectations. We expect the 10-Year T-bond annual yield to reach as high as 3.8% by the end of 2017, before eventually settling at around 3.5% for the subsequent five years.

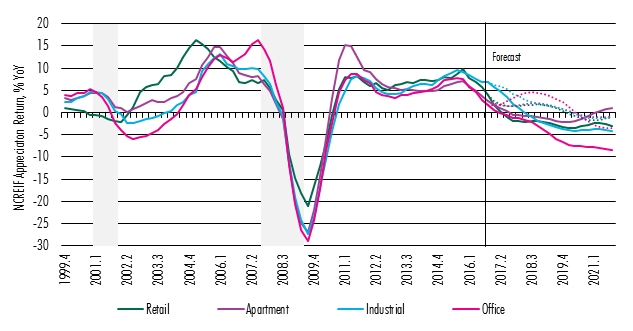
Figure 3: NCREIF NPI Appreciation Returns, National Sectors:
Baseline vs. Higher Interest Rates & Growth (Dashed)

170308 Chervachidze - Interest Rates CRE Values - Fig 3

Sources: CBRE Econometric Advisors Investment Outlook, Q4 2016.

Economic growth during this period leads to continued NOI growth. At first, cap rates adjust very little in response to interest rate increases, as the expected NOI growth—stemming from strong economic growth—is priced into asset prices. Cap rate-to-Treasury spreads compress to historic lows through the end of 2018 as a result. Asset values continue to grow during this time as a consequence.

As economic growth begins to moderate from around 2.9% GDP annual growth in early 2018 to 1.9% at the end of 2019 and 1.6% by the end of 2020, investor income growth expectations and pricing sentiment adjust accordingly. As a result, cap rates finally begin to respond to the higher interest rate environment in 2019, as investors reconcile the reality of lower expected income growth with a higher interest-rate environment. Cap rate spreads over Treasurys begin to trend upward toward long-term averages, and cap rates increase as a result of this repricing. The adjustment is gradual, however, since economic growth would be ongoing, albeit at a much slower rate.

Asset price growth first slows to zero during this time, and then turns slightly negative in most markets as values are repriced for the new interest rate environment and moderating economic and CRE income growth expectations. Again, while positive NOI dynamics are likely to mitigate some of the effect of the cap rate increases, the net effect on values nonetheless remains negative through the end of 2022. Starting in 2023, asset value growth returns to low positive levels for all sectors except office, which takes longer to return to positive dynamics.

Cap rates are likely to continue their gradual upward adjustment after 2021, bringing pricing more in line with the interest rate environment. However, longer-term performance will depend on whether the U.S. economy continues to grow or experiences a slowdown—a result that will depend on both the policy actions of the U.S. government and the global economic environment at that point in time.

Figure 4: NCREIF NPI Total Returns, National Sectors:
Baseline vs. Higher Interest Rates & Growth (Dashed)

170308 Chervachidze - Interest Rates CRE Values - Fig 4

Sources: NCREIF, CBRE Econometric Advisors Investment Outlook, Q4 2016.

Summary

All in all, with the U.S. economy facing policy and economic uncertainty over the next five years, the U.S. macroeconomic outlook is unclear. The range of possible economic and CRE performance is quite wide, then, as our two scenarios illustrate. Interest rate increases represent a risk for asset values under both scenarios—regardless of the timing of the next recession, then—though the magnitude of value drops is quite different for the two scenarios.

The timing and magnitude of the negative adjustment will also be influenced by elements not explicitly accounted for in our analysis (global capital inflows, positive investor sentiment, possibility of trade wars, unexpected policy changes), which could be mitigating or exacerbating factors and will affect the timing of the adjustment. These complicating factors aside, some negative adjustment of asset values in response to higher interest rates is very likely. This is a significant risk that savvy investors will have to consider in their investment strategies over the next five years.


Ready to Get Started?

60 second demos.


WATCH NOW

Experience the platform.


TRY IT TODAY

Become a client.


NEXT STEPS
redirect pin user minus plus fax mobile-phone office-phone data envelope globe outlook retail close line-arrow-down solid-triangle-down facebook globe2 google hamburger line-arrow-left solid-triangle-left linkedin play-btn line-arrow-right solid-triangle-right search twitter line-arrow-up solid-triangle-up calendar globe-americas globe-apac globe-emea external-link music picture paper pictures play gallery download rss-feed vcard