How Can We Help You?

Sector and market analytics

Driven by economists and leveraged by market makers.
CRE performance across major metros and asset classes. History and forecast by CBRE.

Thought leaders abound

Depth, breadth and rigor concentrated at all levels.
Synthesizing macro factors and leading indicators into actionable national, sector and market research.

Advantage is CBRE

Perspectives, scale and connections that work.
Commercial and cultural insight aligned with intellectual capital and experience to fuel informed real estate decision-making.

Which data are right for you?

Data views and extracts by scenario and on demand.
Check out the fundamentals, capital markets, and data tools now on our one-pager.

Experience the platform

See first hand why top institutional investors, direct lenders and private equity firms are clients.
Set a time that works for you.

Click the link above to access all EA Insights

The rise of non-traditional rent concessions and their impact on returns

Sep 27, 2017, 12:51 PM by User Not Found

Given the strong supply response to years of robust demand, it’s no surprise that concessions are now on the rise in many multifamily markets. Interestingly, operators and developers are increasingly turning to non-traditional concessions—cash gift cards, free parking, transportation credits on ride sharing platforms, beer-of-the-month memberships and more.

CBRE Econometric Advisors’ same-store rent index is an index of effective rents, meaning it takes concessions into consideration. Data providers only account for concessions of free rent, however, as non-traditional concessions are recorded as operating expenses and, hidden in marketing budgets, are difficult to track.

This accounting impacts NOI all the same, but an investor might see a marketing budget that appears bloated and want to downsize it, only to learn that many of these “marketing” dollars are in fact much stickier non-traditional concessions.

The impact of non-traditional concessions on calculated returns can be significant. Consider this example:

  • An investor buys a prototypical 100-unit property on a three-year hold.
  • We assume rent growth, vacancy rates, and cap rates from CBRE EA’s upside forecast scenario.
  • We assume a 45-unit (45%) turnover each year, with a “hidden” $750 cash concession for each.
  • We assume an OpEx ratio equal to 35% of Total Gross Income
  • We assume a one-time CapEx charge in year zero, equal to 4% of the purchase price.


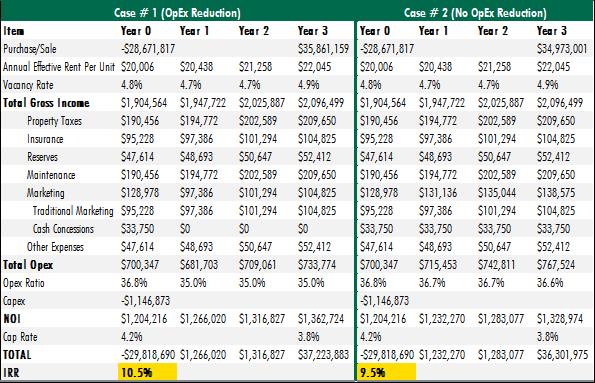
The following table models IRR where the investor can reduce OpEx by the total amount of non-traditional concessions (Case #1), and IRR with zero reductions (Case #2).


OpEx Reduction Table


The cash concessions reduce IRR by 100 basis points (bps). This 100 bps is no small change, making it clear that non-traditional concessions can have a material impact on returns. During the acquisition process, special attention should be given to a property’s marketing budget.

And while due diligence is an important part of understanding cashflow performance, the path of the economy drives returns—so it’s important to select the right economic outlook when underwriting. If we apply CBRE EA’s baseline economic scenario (rather than the upside) to our example above, both IRRs fall by a whopping 7.8 percentage points.


Ready to Get Started?

60 second demos.


WATCH NOW

Experience the platform.


TRY IT TODAY

Become a client.


NEXT STEPS
redirect pin user minus plus fax mobile-phone office-phone data envelope globe outlook retail close line-arrow-down solid-triangle-down facebook globe2 google hamburger line-arrow-left solid-triangle-left linkedin play-btn line-arrow-right solid-triangle-right search twitter line-arrow-up solid-triangle-up calendar globe-americas globe-apac globe-emea external-link music picture paper pictures play gallery download rss-feed vcard