/cbre_logo.png?sfvrsn=eac6e070_4)
How Can We Help You?
Sector and market analytics
Thought leaders abound
Advantage is CBRE
Which data are right for you?
Experience the platform
Click the link above to access all EA Insights
How much do U.S. hotels depend on international guest stays?
If you ask a person on the street how many people from outside the U.S. visit our fine country each year, the answer would likely be “a lot!” If the same question is posed to a hotel industry expert, the respondent may provide a number close to the actual total of 77,501,282 reported by the U.S. Department of Commerce for 2015. However, few experts could accurately translate international visitation into actual room nights, and likely would have difficulty assigning international visitation and room night totals to cities. The difficulty in making these estimations is that many international travelers stay in the U.S. multiple nights in multiple cities, often have occupancies of more than one person per room, and sometimes stay with friends or family rather than in hotels.
International occupancy is generally an important component of the hotel market mix, both nationally and in large cities. Exactly how important is not well-established by data from trusted industry sources. In this edition of Hotel Currents, we use U.S. government statistics, city travel and tourism reports, and a set of assumptions to come up with proportional allocations of international guest stays in the nation and selected large cities. We find that the number of hotel room nights consumed by international visitors exceeds our expectations.
Data with Disclaimers
The U.S. Department of Commerce produces a wide variety of statistics derived from surveys[1] related to inbound travel to the U.S., including types of lodging selected by international travelers. Because these reports do not provide a complete picture of hotel demand by international travelers, selected data are extracted and married with STR data to refine our estimates. Missing information needed to complete the estimations come from thoughtful, conservative assumptions. For example, much of the federal government published information for the nation and cities references overseas travel, while visitation from Canada and Mexico is only reported for the entire U.S. Local data and assumptions therefore are needed to arrive at total (i.e., inclusive of Canadian and Mexican visitors) international visitation for cities.
Visitor agency reports from leading cities provide guidance for some of our estimates. Most of these local reports provide information at high levels of aggregation regarding international travel behaviors without much detail. The notable exception is the 2017 annual report from Miami, which include many characteristics about international visitations.
Estimating National and City International Hotel Occupancy
The process of determining the shares of total rooms sold in a year to domestic and international travelers begins with estimating total international visitation. Here is the process we follow:
- Collect the total number of overseas international visitors to the U.S. and the top-20 city destinations. Source: U.S Department of Commerce, 2015a.
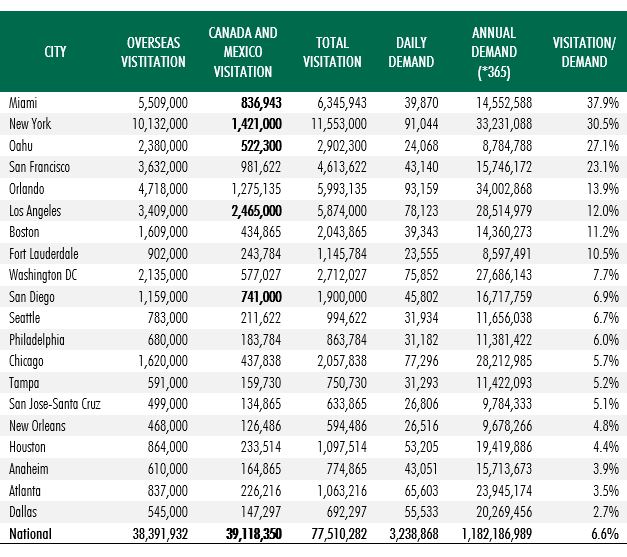
- To these statistics we add the number of visitors coming from Canada and Mexico. Statistics for the U.S. come from the Commerce Department, but city data on these travelers is scarce. We capture actual numbers of Canadian and Mexican visitors for the following cities: Miami, New York, Los Angles, Oahu and San Diego. These visitors add between 14% (New York) to 72% (Los Angeles) to the overseas totals. For the nation in 2015, Canadian and Mexican visitors (38,391,932) nearly equal in number overseas visitors (39,118,350). For cities with missing data on visitation from Canada and Mexico, we computed the average percentages from the five cities and nation for which we have actual numbers (mentioned above). This average is 27%, meaning that total visitation for the 15 cities without hard data equals their overseas visitor totals times 1.27.
- From STR, we assemble annual 2015 demand (i.e., number of rooms sold) data for the nation and the 20 cities, and calculate the ratio of international visitation-to-hotel demand for reference purposes, recognizing that visitation does not equal hotel stays.
To convert international visitation to hotel rooms we need three key inputs. They are:
- The percentage of visitors who select hotels versus other types of occupancy, such as staying with friends and relatives.
- The number of visitors who occupy one room.
- The duration of the hotel stays (i.e., number of room nights consumed), including how many cities visited.
Here is the process followed to introduce these factors.
- The Commerce Department does not report on the percent of international visitors (overseas) who select hotels for lodging. The Miami report shows five years of data (2012-2016) for which this percentage ranges from 47.0% to 73.6%. Given that the 73.6% recorded in 2014 appears to be somewhat of an outlier, we elected to use the most recent level of 58.0%.
- Our investigation revealed travel party sizes range from 1.8 persons for overseas travelers to the U.S. (Department of Commerce, 2015a) to 2.28 persons for all international travelers to Miami. We lean toward the Miami number because it includes Canadian and Mexican visitors and because the attractions offered in Miami are representative of those available in other large city destinations that encourage leisure travel. Therefore, our assumption is 2.2 persons.
- The two main sources that we consult report length of stays by international visitors from five to nearly 10 days. One Commerce Department report (2015b) indicates that overseas international visitors are in the U.S. for an average of 9.7 days and go to 1.6 states. Adjusting visitation totals for length of hotel stay in one city for all international travelers is somewhat problematic, so we err on the conservative side by using five days as our duration assumption.
Results
Figure 1 presents our raking of the highest-to-lowest ratios of international travel to number of rooms occupied in 2015 for the U.S. as whole and for the top-20 city markets. Two cities—Miami and New York—have ratios exceeding 30%. The national ratio is 6.6%.
Figure 1: International Visitation and Hotel Demand in the U.S. and Top Cities, 2015

Note: Numbers in bold type for Canada and Mexico visitation are actuals; other non-bolded numbers are estimates.
Source: U.S. Department of Commerce International Trade Administration; STR, and City Visitor Reports.
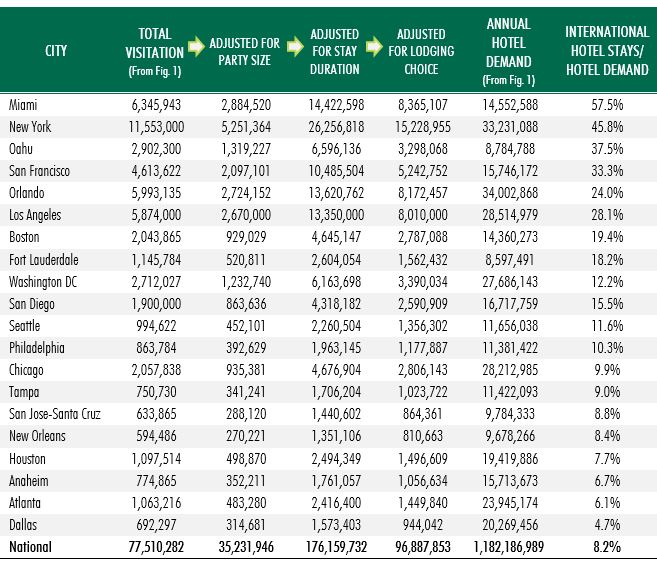
In Figure 2 we show how international visitation totals from Figure 1 are (1) deflated by party size, (2) inflated by duration of stay, and (3) deflated by lodging choice. The results from this series of adjustments are then divided by annual hotel demand from Figure 1 to arrive at estimates of the contributions of international hotel guests to total demand. The adjustments have the effect of meaningfully increasing the contribution ratios from international visitation in Figure 1 to international hotel stays in Figure 2. We estimate that 8.2% of all hotel guests in the U.S. come from foreign countries. Hotel demand in several cities—mostly along the coasts and led by Miami at 57.5%—are highly dependent on international guests. Because the large city numbers tend to skew the national contribution ratio, international travel appears inconsequential to the health of most U.S. hotel markets.
Figure 2: International Hotel Stays and Hotel Demand in the U.S. and Top Cities, 2015

Sources: U.S. Department of Commerce International Trade Administration; STR, and City Visitor Reports.
Robustness Check
To assess the robustness of our city international visitation estimates, we refer to the results from comparable research by Tourism Economics (TE), a unit of Oxford Economics. Tourism Economics uses a proprietary database (i.e., Global City Travel) that analyzes 50 U.S. and 300 global cities. Its estimates of total annual visitors to each city come from an aggregation of intended address from customs forms, length of stay plans, OAG destination data and local Convention Visitors Bureau subscribers to its service. While the sources of the data are clearly presented for the TE analysis, the methods by which the firm arrived at its conclusions are unknown.
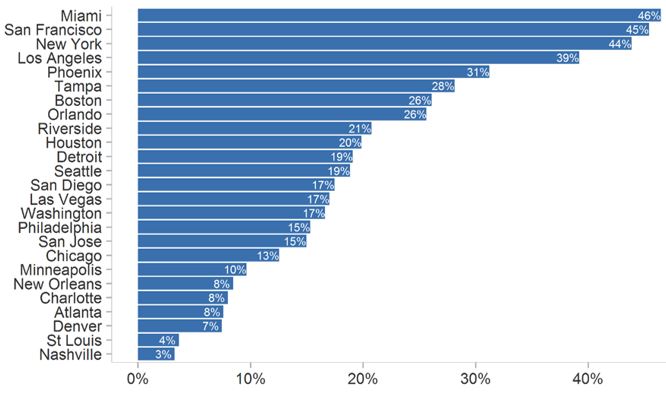
A parallel examination of TE estimates presented in Figure 3 and our own in Figure 2 reveals many similarities. After removing Oahu, which TE does not include, the order of cities in the two lists matches up quite well when arranged from highest percentage international hotel stays to lowest. New York City, for example, is number two on our list with 45.8% international stays; TE lists New York City as number three with 44% international stays. Miami is No. 1 on both lists, although we estimate more than 10% more international stays (57.5% vs. 46%). The second opinion derived from TE provides confidence regarding the integrity of our approach and reported numbers.
Figure 3: Importance of International Visitors

Source: Tourism Economics
Postscript
Are we surprised at how high the contribution ratios for international hotel demand are?
Yes!
[1] The latest releases of these data come from 2014 and 2015.
References
- Greater Miami and the Beaches 2016 Visitor Industry Overview (2017). Greater Miami and the Beaches.
- Los Angeles Tourism and Convention Board, Discover Los Angeles (2017). Los Angeles Tourism by the Numbers.
- Nahoopii, D., J. Chun, MC. Chun, and L. Liu (2017). Visitor Statistics. Visitor Statistics | Annual Visitor Research Report. Hawaii Department of Business, Economic Development & Tourism,
- NYC and Company (2017). NYC Visitation Statistics. Nycgo.com.
- Ryan, A., Sacks, A. (2017). The Impact of Trump on Global Travel. Tourism Economics.
- San Diego Tourism Authority (2017). San Diego County 2017 Visitor Industry General Facts.
- U.S. Department of Commerce, International Trade Administration (2015). 2014 Sector Profile: Lodging.
- U.S. Department of Commerce International Trade Administration (2016a). Top 10 Markets International Markets: 2015 Visitation and Spending.
- U.S. Department of Commerce International Trade Administration (2016b). International Visitation to the United States: A Statistical Summary of U.S. Visitation (2015p). Washington.org (2016). Washington, DC Visitor Research. DC Press.
Ready to Get Started?
60 second demos.WATCH NOW |
Experience the platform.TRY IT TODAY |
Become a client.NEXT STEPS |


