How Can We Help You?

Sector and market analytics

Driven by economists and leveraged by market makers.
CRE performance across major metros and asset classes. History and forecast by CBRE.

Thought leaders abound

Depth, breadth and rigor concentrated at all levels.
Synthesizing macro factors and leading indicators into actionable national, sector and market research.

Advantage is CBRE

Perspectives, scale and connections that work.
Commercial and cultural insight aligned with intellectual capital and experience to fuel informed real estate decision-making.

Which data are right for you?

Data views and extracts by scenario and on demand.
Check out the fundamentals, capital markets, and data tools now on our one-pager.

Experience the platform

See first hand why top institutional investors, direct lenders and private equity firms are clients.
Set a time that works for you.

Click the link above to access all EA Insights

How much should you care about planned units?

Jan 8, 2018, 13:22 PM by User Not Found

In multifamily investment, a market’s supply pipeline is a critical factor in site selection—and for good reason. If the economy is slowing or entering a downturn, a looming supply overhang can raise competition among assets, with rent growth slowing or inverting as vacancy rises, hurting revenue. Units under construction is the primary metric for assessing supply risk, but it’s important to also consider the risk posed by planned units.

To assess this risk, we took each market’s current number of planned units as a percentage of its stock and then factored in a probability for their completion within a five-year timeframe, based on historical probabilities of the same taken at the peak of the last cycle.

Specifying the peak of the last real estate cycle ensures a valid comparison, as we are likely at a similar point in the current expansion. And our five-year window excludes units that were deferred into the downturn and ultimately delivered during the subsequent cycle, as they aren’t relevant in assessing risk during this cycle.

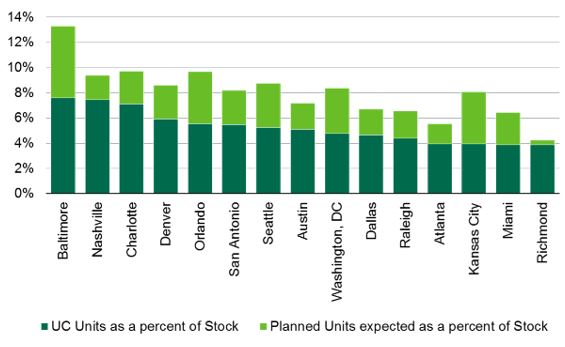
Figure 1: New Units Expected, as a Percent of Stock

171214 Pipeline Blog Fig 1

Source: CBRE Econometric Advisors, Q4 2017.

In Figure 1 are the top 15 supply growth markets, as measured by units under construction as a percent of stock. For many of these markets, the number of additional planned units (that are likely to be completed within the timeframe) represents a significant addition to the pipeline—additions ranging from 0.4% (Richmond) to 5.7% (Baltimore) and averaging 2.8%. Baltimore and Orlando are two markets high numbers for both under-construction and planned units. Houston and Detroit are examples of markets with very low numbers for both under-construction and planned units, with the latter amounting to additions of 1.9% and 1.2%, respectively.

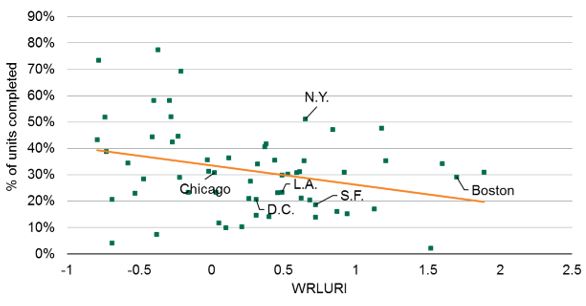
Why do the numbers of planned units likely to complete differ so widely by market? The amount of land regulation in a market is a pragmatic, if imperfect, gauge of its planned units’ likelihood to be completed in a timely manner. In Figure 2, we plot each market’s percentage of currently planned units expected within five years against the Wharton Residential Land Use Regulation Index (WRLURI). The more tightly a market is regulated, the higher its score on the Index.

Figure 2: Percentage of Units Completed vs. WRLURI

171214 Pipeline Blog Fig 2

Source: CBRE Econometric Advisors, Q4 2017.

As you can see, planned units’ likely impact on supply varies greatly by market, but it is substantial in many cases. Generally, high numbers of planned units may warrant concern in markets with lax regulation.


Ready to Get Started?

60 second demos.


WATCH NOW

Experience the platform.


TRY IT TODAY

Become a client.


NEXT STEPS
redirect pin user minus plus fax mobile-phone office-phone data envelope globe outlook retail close line-arrow-down solid-triangle-down facebook globe2 google hamburger line-arrow-left solid-triangle-left linkedin play-btn line-arrow-right solid-triangle-right search twitter line-arrow-up solid-triangle-up calendar globe-americas globe-apac globe-emea external-link music picture paper pictures play gallery download rss-feed vcard