How Can We Help You?

Sector and market analytics

Driven by economists and leveraged by market makers.
CRE performance across major metros and asset classes. History and forecast by CBRE.

Thought leaders abound

Depth, breadth and rigor concentrated at all levels.
Synthesizing macro factors and leading indicators into actionable national, sector and market research.

Advantage is CBRE

Perspectives, scale and connections that work.
Commercial and cultural insight aligned with intellectual capital and experience to fuel informed real estate decision-making.

Which data are right for you?

Data views and extracts by scenario and on demand.
Check out the fundamentals, capital markets, and data tools now on our one-pager.

Experience the platform

See first hand why top institutional investors, direct lenders and private equity firms are clients.
Set a time that works for you.

Click the link above to access all EA Insights

Three-year outlook: Capital appreciation in U.S. CRE assets unlikely; investors should focus on income

Nov 2, 2017, 14:07 PM by User Not Found

What can we expect of the U.S. economy, interest rate environment, and—consequently—cap rates and CRE asset pricing over in the next three years?

To address the question, we divided the range of likely economic outcomes into three different macroeconomic scenarios and used our forecasting models to judge their implications for cap rates.

Our findings indicate that however the economy performs, the next three years are unlikely to see meaningful cap rate compression. Under two of the three scenarios, our models forecast some degree of upward cap rate movement. This implies that CRE values will either remain relatively flat or experience temporary declines of magnitudes ranging from mild to moderate, depending on which scenario plays out.

Investors should therefore not count on appreciation returns—the mainstay of CRE returns over the past five years—when structuring investment strategies for the next three years. Rather, the steady income returns that CRE is likely to generate over the period provide a solid basis for such strategy as investors simply wait out the asset value fluctuations.

These findings should not suggest that CRE is unattractive for investment in the short term. On the contrary—compared to other asset classes, the steady income-generating/inflation-hedging characteristics of CRE may prove very attractive. Betting on further CRE asset appreciation is simply unlikely to pay off over the period, so investors should focus on the income component until any values adjustment is complete.


Scenario #1: Mild Recession

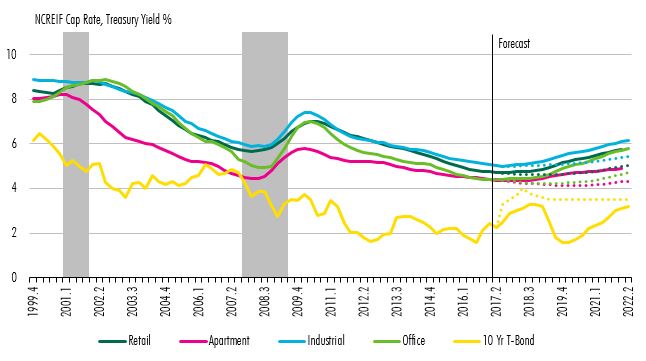
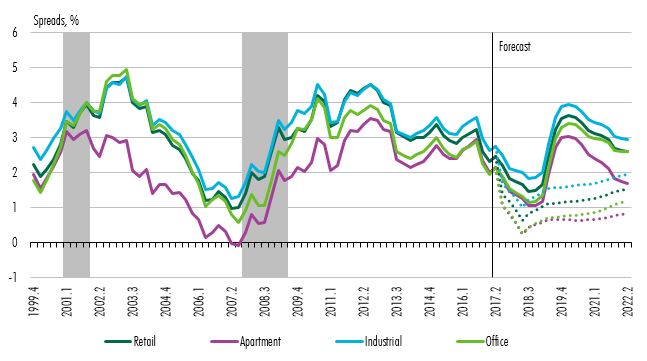
(Shown as solid lines in Figures 1 and 2)

  • Growth continues in 2017 and early 2018, followed by a short, mild slowdown/recession in 2019.
  • GDP growth barely dips below 0% for a single quarter and the economy returns to growth in 2020.
  • Interest rates[1] rise to 3.3% by the end of 2018…
  • And then fall (significantly) to 1.6% by 2020, as the Fed shifts to an easing stance and a “flight to safety” increases the U.S.-bound flow of global capital.
  • Once growth resumes, interest rates normalize, with the 10-year returning to its trend rate of around 3.5%.

Under these conditions, cap rates slowly adjust to higher interest rates in 2018 and then continue to trend upward during the slowdown, driven by widening risk premiums and lower expectations for rent growth. Growth then resumes and cap rates settle 100-180 bps above current levels by the end of 2023.

Figure 1. NCREIF Cap Rates:
Mild Recession (Solid) vs. Robust Growth (Dashed)

Cap Rates Forecast 17Q2 Fig 1

Source: NCREIF, CBRE Econometric Advisors, Q2 2017.

Figure 2. Spread over 10-Year Treasury Yield, NCREIF NPI Cap Rates:
Mild Recession (Solid) vs. Robust Growth (Dashed)

Cap Rates Forecast 17Q2 Fig 2

Source: NCREIF, CBRE Econometric Advisors, Q2 2017.
 

Scenario #2: Robust Growth

(Appears as dotted lines in Figures 1 and 2)

  • Growth is robust for two years, and then moderates.
  • Interest rates rise more quickly and higher—to 4% by Q3 2018…
  • and then drop slightly to settle at 3.5%.

Cap rates stay essentially flat (possibly compressing slightly) through Q3 2019 (as robust economic growth is priced in), but then begin to trend up slowly as expectations adjust in response to slowing growth. Cap rates settle 10-50 bps above current levels by the end of 2023.


Scenario #3: Slow Growth

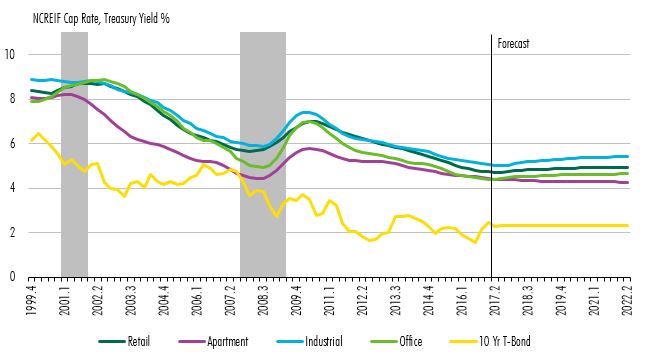
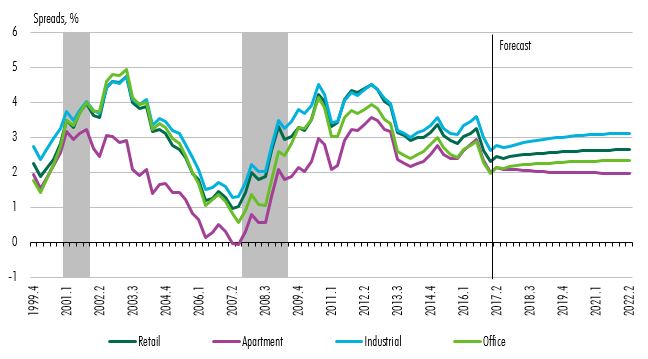
(A five-year forecast; shown in Figures 3 and 4)

  • Interest rates, inflationary expectations and risk premia remain roughly at current levels.

Under this scenario, cap rates either stay flat or trend up slightly, increasing by up to 25 bps over five years (as robust growth expectations dissipate and slow growth is priced in by investors).

Figure 3. NCREIF Cap Rates: Slow Growth

Cap Rates Forecast 17Q2 Fig 3

Source: NCREIF, CBRE Econometric Advisors, Q2 2017.

Figure 4. Spread over 10-Year Treasury Yield, NCREIF NPI Cap Rates: Slow Growth

Cap Rates Forecast 17Q2 Fig 4

Source: NCREIF, CBRE Econometric Advisors, Q2 2017.


[1] as represented by the 10-year T-Bond yield


Ready to Get Started?

60 second demos.


WATCH NOW

Experience the platform.


TRY IT TODAY

Become a client.


NEXT STEPS
redirect pin user minus plus fax mobile-phone office-phone data envelope globe outlook retail close line-arrow-down solid-triangle-down facebook globe2 google hamburger line-arrow-left solid-triangle-left linkedin play-btn line-arrow-right solid-triangle-right search twitter line-arrow-up solid-triangle-up calendar globe-americas globe-apac globe-emea external-link music picture paper pictures play gallery download rss-feed vcard