How Can We Help You?

Sector and market analytics

Driven by economists and leveraged by market makers.
CRE performance across major metros and asset classes. History and forecast by CBRE.

Thought leaders abound

Depth, breadth and rigor concentrated at all levels.
Synthesizing macro factors and leading indicators into actionable national, sector and market research.

Advantage is CBRE

Perspectives, scale and connections that work.
Commercial and cultural insight aligned with intellectual capital and experience to fuel informed real estate decision-making.

Which data are right for you?

Data views and extracts by scenario and on demand.
Check out the fundamentals, capital markets, and data tools now on our one-pager.

Experience the platform

See first hand why top institutional investors, direct lenders and private equity firms are clients.
Set a time that works for you.

Click the link above to access all EA Insights

Market Affordability: Looking ahead

Feb 23, 2018, 15:29 PM by User Not Found

I recently moved from Boston to Denver and the difference in cost of living served as a welcome income multiplier. I’m not alone in that experience. Strong push and pull factors are underpinning U.S. demographic and migration trends as well as the local economic strength of markets like Denver, Austin, Nashville, Phoenix and more.

Although affordability plays a key role in attracting dozens of new households to each of these lower-cost cities every day, it’s not enough for a market to simply offer a low cost of living—it must offer a balance between cost and quality-of-life.

The percent of their income that residents spend on rent is common measure of a city’s affordability. As CBRE EA forecasts apartment fundamentals under a Moody’s economic scenario, combining our rent forecasts with Moody’s forecasted median household income data provides a market-level forecast of affordability.

What lies ahead for affordability? The short answer is “nothing surprising”:

  • Rent growth will continue to moderate across markets as late-cycle supply and demand dynamics find balance.
  • Wage appreciation is expected to accelerate as labor markets continue to tighten.
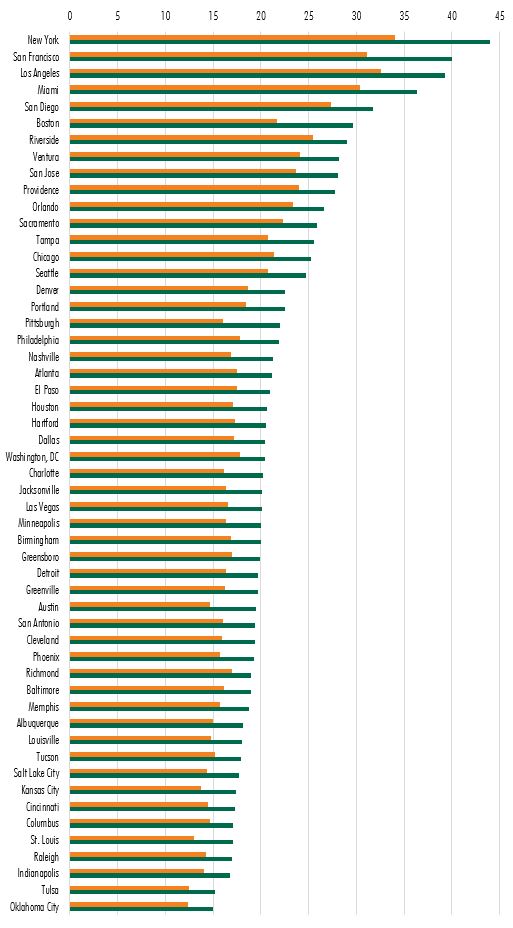
  • All markets should see some improvement in affordability, leaving the ranking mostly intact.
  • New York City is expected to remain the least affordable city in the country.
  • Los Angeles could overtake San Francisco to become the second least affordable market in the country.

Figure 1 ranks markets based on current affordability (green bars) and provides a forecast of affordability five years from now (orange bars).

Figure 1: Market Affordability (Rent as a Percent of Median Household Income)

U.S. Metro Affordabillity 2018Q1

Source: CBRE Econometric Advisors, Moody's Analytics; 2018.

A household is typically considered “cost burdened” when its rent exceeds 30% of its income. Although this threshold is not universally applicable, it does provide a point of reference for considering relative affordability across markets.


Ready to Get Started?

60 second demos.


WATCH NOW

Experience the platform.


TRY IT TODAY

Become a client.


NEXT STEPS
redirect pin user minus plus fax mobile-phone office-phone data envelope globe outlook retail close line-arrow-down solid-triangle-down facebook globe2 google hamburger line-arrow-left solid-triangle-left linkedin play-btn line-arrow-right solid-triangle-right search twitter line-arrow-up solid-triangle-up calendar globe-americas globe-apac globe-emea external-link music picture paper pictures play gallery download rss-feed vcard