How Can We Help You?

Sector and market analytics

Driven by economists and leveraged by market makers.
CRE performance across major metros and asset classes. History and forecast by CBRE.

Thought leaders abound

Depth, breadth and rigor concentrated at all levels.
Synthesizing macro factors and leading indicators into actionable national, sector and market research.

Advantage is CBRE

Perspectives, scale and connections that work.
Commercial and cultural insight aligned with intellectual capital and experience to fuel informed real estate decision-making.

Which data are right for you?

Data views and extracts by scenario and on demand.
Check out the fundamentals, capital markets, and data tools now on our one-pager.

Experience the platform

See first hand why top institutional investors, direct lenders and private equity firms are clients.
Set a time that works for you.

Click the link above to access all EA Insights

Where are the workers coming from? January and February

Mar 11, 2019, 15:27 PM by User Not Found

The strong figures in January’s jobs report were actually quite similar to those in many of the past year’s monthly reports. Over the past year, the U.S. economy has averaged about 250,000 new jobs monthly—an annual rate of 3 million. Meanwhile, the number of unemployed-and-discouraged workers has been essentially stable, declining a bit during the first half of 2018 and now rising somewhat. The decade-long downward trend in this series appears to have ended. Note that I have used the broader definition of those out of work—one that includes workers not actively looking for employment. Hence the calculated labor force growth over the past year has roughly equaled the growth in jobs: 3 million.      

The past year’s monthly average is very different from the monthly average for the entire nine-year recovery—2010 through 2018. Over that period, the average annual job growth was a bit less than 2 million, 650,000 of which came from decline in unemployed-plus-discouraged workers. That leaves the new jobs from labor force growth at an annual average of 1.3 million. This derived growth in the labor force is just slightly below what demographers have been predicting based on births and aging—with the assumption of constant labor force participation. So what has happened in the past year that made the labor force grow at more than twice its trend rate of the past decade? Clearly, it involves changes in labor force participation: workers that previously were not interested in working, now—for some reason—are.

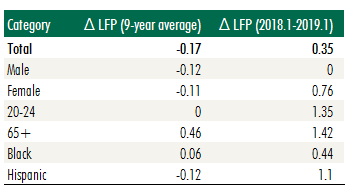
The change in labor force participation (LFP) over the past decade can give us some insight into what may have caused this increased interest in working. These data, from the BLS’s Current Population Survey, differ a bit from our calculated data. We highlight the average annual percentage point change from 2010-2018 and then during the past year.  

Figure 1. Annual Change in LFP rate, in percentage points

190311 Jobs - Fig 1

Source: Bureau of Labor Statistics, Census Bureau; Q1 2019.

Three observations: First, LFP has ticked up quite significantly in the past year, in total and for all groups, relative to the previous nine years’ gradual decline. Second, the longer-term growth in LFP is actually quite small for all of these categories except for one: those over 65 (without disability), who have shown a pronounced increase in participation. And third: females, minorities, young and retirement-age workers have all increased their participation rates dramatically over the past year. Only males (and especially white males) have not. No doubt there is an interesting story for each of these groups; collectively, however, the data show that the U.S. is simply running out of workers. To maintain the past year’s rate of job growth would require structural changes to what interests people in working. Without such changes, a secular reduction in job growth seems inevitable.

And now for February’s surprise. The unemployment rate’s 0.1% drop would have seen 140,000 jobs created; with only 20,000 new jobs in February, the labor force must have contracted from a lower rate of participation. It is never wise to rely on monthly numbers, but February could perhaps be a warning that U.S. labor force growth is near to exhaustion. With unemployment at its lower bound, any job growth beyond demographically-driven job growth must arise from structural change—change that is not well understood and should not be counted on. With the labor labor market so tight, perhaps February’s more significant wage growth will continue. 

Ready to Get Started?

60 second demos.


WATCH NOW

Experience the platform.


TRY IT TODAY

Become a client.


NEXT STEPS
redirect pin user minus plus fax mobile-phone office-phone data envelope globe outlook retail close line-arrow-down solid-triangle-down facebook globe2 google hamburger line-arrow-left solid-triangle-left linkedin play-btn line-arrow-right solid-triangle-right search twitter line-arrow-up solid-triangle-up calendar globe-americas globe-apac globe-emea external-link music picture paper pictures play gallery download rss-feed vcard