How Can We Help You?

Sector and market analytics

Driven by economists and leveraged by market makers.
CRE performance across major metros and asset classes. History and forecast by CBRE.

Thought leaders abound

Depth, breadth and rigor concentrated at all levels.
Synthesizing macro factors and leading indicators into actionable national, sector and market research.

Advantage is CBRE

Perspectives, scale and connections that work.
Commercial and cultural insight aligned with intellectual capital and experience to fuel informed real estate decision-making.

Which data are right for you?

Data views and extracts by scenario and on demand.
Check out the fundamentals, capital markets, and data tools now on our one-pager.

Experience the platform

See first hand why top institutional investors, direct lenders and private equity firms are clients.
Set a time that works for you.

Click the link above to access all EA Insights

Summary of EA's Q3 outlook: Macro and by sector

Oct 31, 2019, 08:47 AM by User Not Found

U.S. Economy

GDP growth continued to slow in Q3 2019; its annual rate of 1.9% was down slightly from Q2’s 2.0% and down significantly from Q1’s 3.1%.  Consumer spending growth remained high at 2.9%, led by gains in durable goods such as autos and furnishings. Declines in stock-building, fixed investment (non-residential) and exports offset some of the growth in consumer spending.

Recent production and survey data indicate a slowing in the economy. Alongside weakness in APAC and EMEA, this has bolstered the case for the Fed to potentially lower interest rates once more before the end of 2019. With subdued economic growth, expect low inflation/inflation expectations and an extended period of low interest rates.

Employment is still growing, but 2019's YTD average monthly gain of 167,000 jobs was below 2018’s monthly average of 223,000, indicating a slowing job market. It should continue to bolster consumer confidence that unemployment remains near a cyclical low of 3.7%. With employment growth slowing, slower (but still positive) absorption of real estate is likely through 2020.

We now expect low but positive economic growth until H2 2021, at which point it should pick up. Our upside and downside forecast scenarios continue to reflect a wide range of possible outcomes. Overall, the U.S. economy remains healthy and broadly supportive of property market fundamentals.

U.S. Apartment

Third quarter data show the vacancy rate for apartments to have dropped another 40 bps, to 3.6%—the sector’s lowest U.S. vacancy rate since 2000.  Rent growth remained healthy as well in Q3 2019, rising 2.9% on a year-over-year basis.

Looking forward to 2020, CBRE EA forecasts vacancy to remain stable at an annual average rate of 4.2%. Rent growth is expected to moderate slightly as economic growth slows, dropping from 2019’s 3.2% to 2.7% in 2020. Beyond 2020, we expect completions to outpace absorption as employment weakens, driving vacancy to a peak of 5.3% in 2022.

U.S. Office

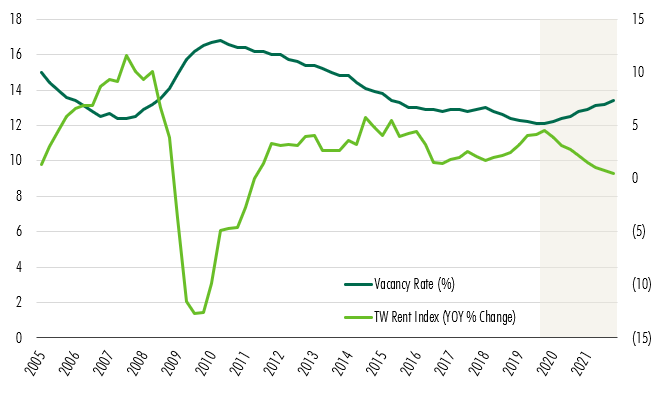
The U.S. office sector’s vacancy rate dropped 10 bps during Q3 2019, to 12.1%, with the rates for suburban and downtown submarkets both decreasing. Completions volume was 9.3 MSF, well below any other quarterly volume from the past 3 years. The 14 MSF of net absorption was on par with recent quarters and puts 2019 YTD absorption above the total for the same period last year. CBRE EA forecasts average vacancy of 12.2% for 2019—50 bps below 2018 levels. For 2020, we expect office vacancy to increase to 12.5%,  due to the record-setting supply volume scheduled for delivery next year.

Office Outlook: Vacancy and Rents
Two-year office outlook: vacancy rise and slowing rent growth

CBRE Econometric Advisors, Q3 2019.

Low vacancy and modest economic growth allowed rents to rise at a robust year-over-year pace of 4.1% in Q3 2019—the fastest pace since 2016.  As vacancy rises and employment growth slows, rent growth is expected to moderate from an average annual rate of 4.0% in 2019 to 3.0% in 2020.

U.S. Industrial

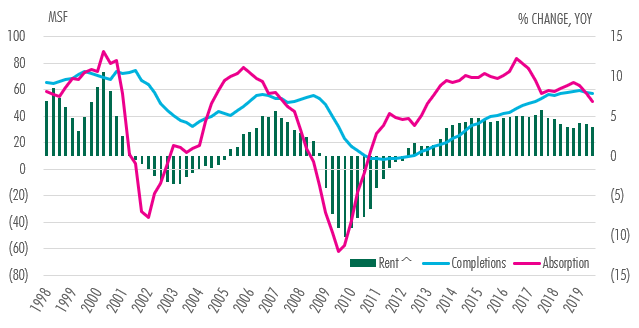
Third quarter industrial data reveal a 24% quarter-over-quarter increase in completions (to 61.6 million sq. ft.) and a 21% quarter-over-quarter increase in net absorption (to 46.3 million sq. ft.). These increases yielded a slight rise in the availability rate, to 7.2%. Completions and absorption have been generally in sync since Q3 2017, when absorption dropped to roughly 60 million sq. ft. per quarter. Since then, rent growth has slowly eroded as well. The past two quarters have seen average absorption drop below completions, leading to the lowest rent growth since 2013. Rents increased to $6.72 in Q3 2019 for a 3.7% year-over-year increase, down from last quarter’s growth of 4.1%.

Industrial Completions and absorption (4-quarter average) vs. Rent growth (YOY)

Declining industrial absorption lowers rent growth

CBRE Econometric Advisors, Q3 2019.

For rents, CBRE EA forecasts a moderate rise in 2020—3.6%, down from 4.0% in both 2018 and 2019. With demand remaining high and recent deliveries providing more available space options, strong gains in net absorption should continue into 2020—though at a lower pace than completions, leading to higher vacancy over the next few years.

U.S.Retail

The availability rate for neighborhood, community and strip centers (NC&S) across CBRE EA’s retail coverage was 8.7% in Q3 2019—down slightly from the previous quarter. Rent growth has been steady for the past few quarters; Q3 registered 2.7%, year over year.

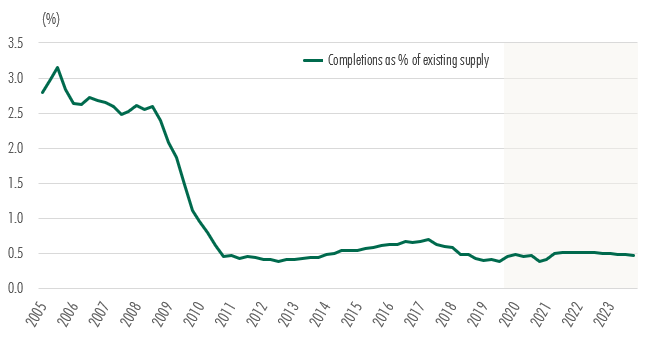
Availability is expected to increase, averaging 8.8% in 2020—up 10 bps from the 2019 rate. Rent growth will slow. Weak demand for retail space is expected throughout our forecast period, due to a combination of e-commerce and a slowing economy. Fortunately, with new completions low, availability will peak at only 9.3% in 2022.

Retail completions (annual) as a percent of existing supply

Retail completions remining low

CBRE Econometric Advisors, Q3 2019.


EA's full Macro Outlook and Forecast Scenarios for Q3 2019 will be available in the next week or so.


Ready to Get Started?

60 second demos.


WATCH NOW

Experience the platform.


TRY IT TODAY

Become a client.


NEXT STEPS
redirect pin user minus plus fax mobile-phone office-phone data envelope globe outlook retail close line-arrow-down solid-triangle-down facebook globe2 google hamburger line-arrow-left solid-triangle-left linkedin play-btn line-arrow-right solid-triangle-right search twitter line-arrow-up solid-triangle-up calendar globe-americas globe-apac globe-emea external-link music picture paper pictures play gallery download rss-feed vcard