How Can We Help You?

Sector and market analytics

Driven by economists and leveraged by market makers.
CRE performance across major metros and asset classes. History and forecast by CBRE.

Thought leaders abound

Depth, breadth and rigor concentrated at all levels.
Synthesizing macro factors and leading indicators into actionable national, sector and market research.

Advantage is CBRE

Perspectives, scale and connections that work.
Commercial and cultural insight aligned with intellectual capital and experience to fuel informed real estate decision-making.

Which data are right for you?

Data views and extracts by scenario and on demand.
Check out the fundamentals, capital markets, and data tools now on our one-pager.

Experience the platform

See first hand why top institutional investors, direct lenders and private equity firms are clients.
Set a time that works for you.

Click the link above to access all EA Insights

U.S. Office Vacancy Index Q1 2020

Apr 16, 2020, 10:29 AM by User Not Found

Office Vacancy Increased in Q1 2020

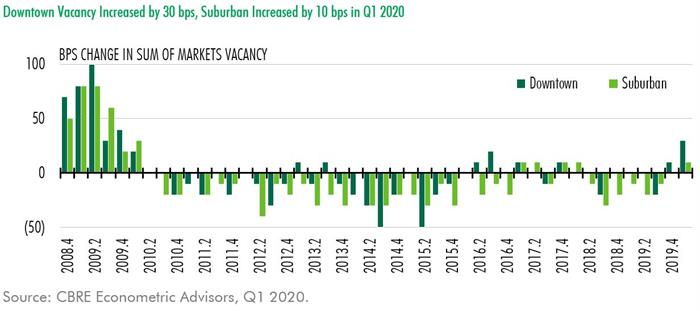
Based on preliminary quarterly results , the vacancy rate for CBRE EA’s Office Sum of Markets increased by 20 bps to 12.3% during the first quarter of 2020, with suburban and downtown submarket rates increasing. Overall, in the most recent four-quarter period, the Sum of Markets vacancy rate remained unchanged thanks to positive momentum in 2019. Year-over-year stability in vacancy is even more prominent considering the large volume of new supply delivered in the past year and tenants’ more efficient use of office space. Despite the Sum of Markets uptick, vacancy continued to fall or stayed flat in more than half of U.S. office markets, declining in 32 of 63, rising in 23, and remaining unchanged in eight. The downtown vacancy rate, based on preliminary estimates, increased by 30 bps to 10.6%, while suburban increased by 10 bps to 13.2%.

The largest quarterly declines in vacancy were recorded in Norfolk (-100 bps), Newark (-80 bps), Philadelphia (-70 bps), and Tucson (-70 bps). Sacramento, Ventura, Portland, Riverside, Cleveland, Detroit, Indianapolis, Oakland and Trenton each declined by 50 bps or more. Over the past four quarters, we have observed tightening vacancy in a variety of markets across U.S. regions, including Trenton, Las Vegas, Norfolk, Memphis, Louisville, Sacramento, San Jose, Honolulu, Philadelphia, Miami, Los Angeles, Tampa, Richmond, Albuquerque, Orange County, Cincinnati, Milwaukee and Pittsburgh. Tech and Research markets continued to record the nation’s lowest vacancy rates including San Francisco (5.8%), Seattle (7.1%), Raleigh (7.4%), Austin (7.9%), New York (8.7%), Boston (9.0%) and San Jose (9.0%).

alex blog

Among the markets with vacancy rate increases in Q1 2020, Tulsa recorded the highest (160 bps) increase in vacancy. San Diego, Stamford, Nashville, Honolulu, Columbus, Fort Lauderdale, Austin, Washington, D.C., San Francisco, Orlando, Wilmington, DE, San Antonio, Long Island and Houston reported rate increases of at least 50 bps. As of Q1 2020, the nation’s highest vacancy rates were in Houston (21.9%), Dallas (18.5%), Albuquerque (18.3%) and Minneapolis (18.3%). Among these, Dallas and Albuquerque maintained high rates while registering vacancy decline versus a year earlier. Year-over-year, vacancy rates were higher in 22 markets including Oklahoma City, Stamford, Nashville, West Palm Beach, Hartford, Wilmington DE, Columbus, Indianapolis, Oakland, Denver, Long Island, San Francisco, Toledo, Albany, San Diego, Kansas City and Houston.

To access the full report and data   BECOME A CLIENT

Ready to Get Started?

60 second demos.


WATCH NOW

Experience the platform.


TRY IT TODAY

Become a client.


NEXT STEPS
redirect pin user minus plus fax mobile-phone office-phone data envelope globe outlook retail close line-arrow-down solid-triangle-down facebook globe2 google hamburger line-arrow-left solid-triangle-left linkedin play-btn line-arrow-right solid-triangle-right search twitter line-arrow-up solid-triangle-up calendar globe-americas globe-apac globe-emea external-link music picture paper pictures play gallery download rss-feed vcard