How Can We Help You?

Sector and market analytics

Driven by economists and leveraged by market makers.
CRE performance across major metros and asset classes. History and forecast by CBRE.

Thought leaders abound

Depth, breadth and rigor concentrated at all levels.
Synthesizing macro factors and leading indicators into actionable national, sector and market research.

Advantage is CBRE

Perspectives, scale and connections that work.
Commercial and cultural insight aligned with intellectual capital and experience to fuel informed real estate decision-making.

Which data are right for you?

Data views and extracts by scenario and on demand.
Check out the fundamentals, capital markets, and data tools now on our one-pager.

Experience the platform

See first hand why top institutional investors, direct lenders and private equity firms are clients.
Set a time that works for you.

Click the link above to access all EA Insights

The Gini coefficient: Measuring how office vacancy is distributed within markets

Sep 29, 2022, 11:55 AM by Matt Mowell

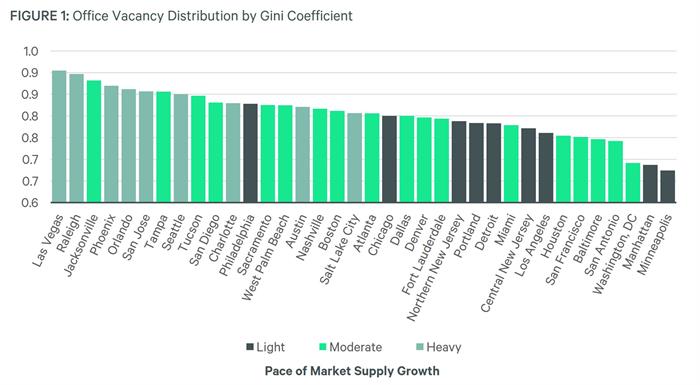
Economists use the Gini coefficient to measure income inequality within a nation or subgroup. This same tool can illuminate how office vacancy is distributed within office markets nationally.

A Gini coefficient close to 1 indicates that vacancy is largely confined to one or two submarkets, usually those with a lot of older office stock.

Markets with the highest Gini coefficients include Las Vegas, Raleigh, Jacksonville, Phoenix and Orlando, which have vacancy rates that are concentrated in a small number of struggling assets. However, most of the market is in much better shape than the headline vacancy rate suggests. These markets have generally seen aggressive new supply growth, resulting in older stock becoming functionally obsolete and struggling to attract tenants.

Headline vacancy better reflects the market's overall health in Washington, D.C., Manhattan, Minneapolis and others with low Gini coefficients. These markets generally see less vigorous supply growth and older stock continues to vie for tenants relatively effectively. No market has a Gini coefficient lower than 0.67-a reminder that even in markets with the most evenly distributed vacancy, leasing success is achieved on a property-by­-property basis.

COTW09222022

Ready to Get Started?

60 second demos.


WATCH NOW

Experience the platform.


TRY IT TODAY

Become a client.


NEXT STEPS
redirect pin user minus plus fax mobile-phone office-phone data envelope globe outlook retail close line-arrow-down solid-triangle-down facebook globe2 google hamburger line-arrow-left solid-triangle-left linkedin play-btn line-arrow-right solid-triangle-right search twitter line-arrow-up solid-triangle-up calendar globe-americas globe-apac globe-emea external-link music picture paper pictures play gallery download rss-feed vcard