How Can We Help You?

Sector and market analytics

Driven by economists and leveraged by market makers.
CRE performance across major metros and asset classes. History and forecast by CBRE.

Thought leaders abound

Depth, breadth and rigor concentrated at all levels.
Synthesizing macro factors and leading indicators into actionable national, sector and market research.

Advantage is CBRE

Perspectives, scale and connections that work.
Commercial and cultural insight aligned with intellectual capital and experience to fuel informed real estate decision-making.

Which data are right for you?

Data views and extracts by scenario and on demand.
Check out the fundamentals, capital markets, and data tools now on our one-pager.

Experience the platform

See first hand why top institutional investors, direct lenders and private equity firms are clients.
Set a time that works for you.

Click the link above to access all EA Insights

Simulated Examples of the CRE Debt Funding Gap

Jul 8, 2025, 13:21 PM by Michael Leahy

The office debt funding gap arises when changes in property value or lending conditions cause the debt available to refinance a property to be less than its outstanding mortgage balance. Previously, we measured the potential aggregate gap using estimated loan maturities, property value changes and current loan-to-value ratios (LTVs). In this analysis, we estimate debt funding gap potential sizes based on hypothetical values.

We modeled an office property loan originated in 2019 with the following characteristics: 4% interest rate; $10 million Net Operating Income (NOI); 5% cap rate, $200 million total value; 72% LTV; $144 million loan balance and $480,000 monthly payment. The debt service coverage ratio (DSCR) was 1.74 and the debt yield was 6.94%. We simulated 611,226 scenarios to estimate the size of the funding gap if a loan were to mature today, using all unique combinations of the following parameters:

  • NOI: Decreasing or increasing up to 50% in 5% increments.
  • LTV: Declining from 0% to 20% in 1% increments.
  • Interest Rate: Increasing from 0% to 5% in 1% increments.
  • Cap Rate: Increasing from 0% to 5% in 0.5% increments.
  • Amortization: Percentage of original balance amortized ranging from 0% to 20% in 1% increments.

In addition, we assumed a minimum DSCR of 1.25 and a minimum debt yield of 8%.

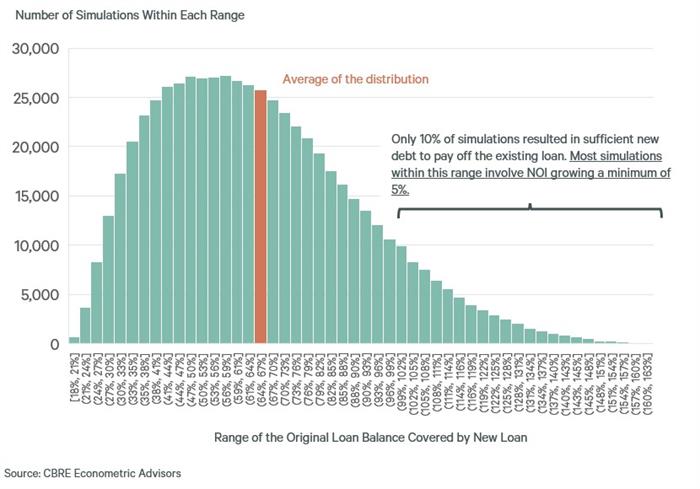
Under these simulations, a typical new loan originated today would cover only 65% of the outstanding balance, requiring fresh equity or additional debt to close the 35% debt funding gap. A new loan would be large enough to pay off the existing loan in only 10% of our simulations, and 99% of these scenarios required NOI to grow by at least 5%, an unattainable growth rate for most office properties in recent years. Of the 144 scenarios that involved no NOI growth and no debt funding gap, the minimum amortization level was 18%.

Although many simulations are more extreme than what most office investors face today, the overall results paint a grim picture of the troubled state of capital structures, especially for properties financed in 2019 – arguably the worst year to have acquired an office asset.

Figure 1: Distribution of Percent of Original Loan Balance Available at Refinance Across Simulations
cotw07082025

Ready to Get Started?

60 second demos.


WATCH NOW

Experience the platform.


TRY IT TODAY

Become a client.


NEXT STEPS
redirect pin user minus plus fax mobile-phone office-phone data envelope globe outlook retail close line-arrow-down solid-triangle-down facebook globe2 google hamburger line-arrow-left solid-triangle-left linkedin play-btn line-arrow-right solid-triangle-right search twitter line-arrow-up solid-triangle-up calendar globe-americas globe-apac globe-emea external-link music picture paper pictures play gallery download rss-feed vcard