/cbre_logo.png?sfvrsn=eac6e070_4)
CBRE Econometric Advisors Launches Prime Office Data
Executive Summary
- Prime, or Class A+, office space has been outperforming Class A space nationwide since the beginning of the COVID-19 pandemic.
- CBRE EA is publishing an aggregated quarterly historical time series, with history back to 2018, on prime office statistics for the top 16 major markets.
- The aggregated prime vacancy rate sits around 14.4% as of Q3 2023, significantly lower than that of Class A buildings, which is roughly 19.4%.
- Aggregated Prime EA Asking Rent increased 8.3% since Q1 2020, while Class A EA Asking Rent dropped 1.7% during that time.
- Prime buildings in these 16 markets, representing approximately 238 million sq. ft. of stock, make up 8.9% of total stock and about 2.3% in terms of total count of buildings. That’s about 7.2% of Class A buildings by count and 13.5% by sq. ft.
Introduction
The office sector has experienced tremendous change since the onset of the pandemic. Inevitable short-term remote work accelerated the acceptance of long-term hybrid work, which then led to dramatically reduced demand for office markets. However, as working patterns evolve and become more flexible, companies are conducting a broader audit of their office space – assessing how much they need as well as what purpose it serves. Looking at the employee more as a consumer, some occupiers are following this path by providing the amenities that better help employees achieve their work-life balance. Whether it’s a fitness center, a café, or being near public transit, better buildings are helping employees live more convenient, fulfilled and efficient lives. In addition, sustainability features like energy efficiency, transitioning to renewable energy, etc., have rapidly joined the checklist both for employees and corporate occupiers.
In 2022, CBRE EA published a Viewpoint titled “Flight to Quality Quantified” in which we studied prime office building performance compared to that of non-prime buildings, focusing on five major downtowns: Boston, Manhattan, Washington, D.C., San Francisco and Seattle. With local expertise provided by our CBRE colleagues, we were able to identify a set of prime buildings in those markets and gauge how prime rent, net absorption and vacancy move compared with the broader market.
The positive feedback and numerous inquiries in response to the Viewpoint made it clear that the market lacked a more expansive prime offering, prompting us to further expand the study to include more markets with more data and to generate an aggregated prime series. With more local input and help from the broad CBRE Research team, we now have prime data for 16 major markets1, and will continue to expand to more Tier I markets.
How is Prime Defined?
Prime assets always meet and often surpass those qualifiers currently used to define Class A. However, in parsing the data we found a rigid quantitative method often fell short of capturing the nuances of individual buildings. To solve this, we worked with local CBRE professionals to identify that select list of assets which are truly 'best in class'. This initial list of prime buildings was then compared against a list derived through purely quantitative measures, with outliers on either list flagged for further scrutiny. As a result, we now track 495 existing prime buildings (273 downtown and the rest in suburbs) in 16 major markets. These prime buildings represent 238 million sq. ft. of stock, 8.9% of total stock and about 2.3% in terms of total count of buildings in these 16 markets.
How has Prime Performed?
Looking at the aggregated data, prime buildings in the top 16 markets registered a vacancy increase from 7.4% in Q1 2020 to 14.4% as of Q3 2023. Downtown prime buildings’ vacancy increased from 7.1% to 14.1%, while suburban prime buildings’ vacancy increased slightly less – 670 bps, from 8.4% to 15.2%.

For the most objective rent comparison, we look at the EA Asking Rent series, a modeled asking rent that is calculated using a proprietary repeat rent index to mark-to-market all buildings in a given market, regardless of availability. The EA Asking Rent for all prime buildings in the top 16 markets grew 8.3% since Q1 2020. Downtown prime rents increased the most, about 9.6%, while suburban remained relatively stable, showing a milder 2.3% increase.
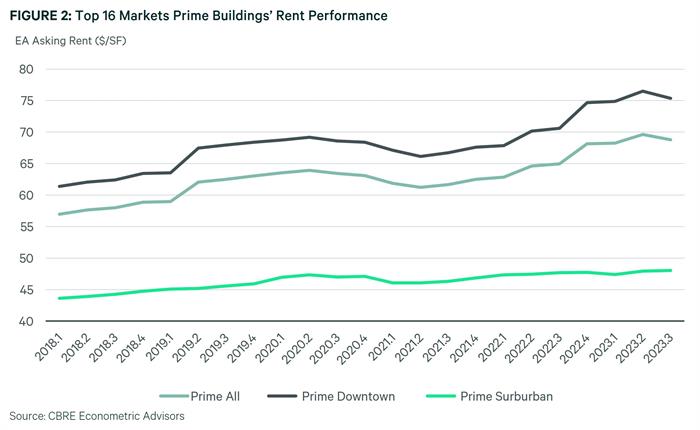
The rent story is even more obvious, as the aggregated prime rent series increased more than 8% since Q1 2020 while market asking rents dropped 1.3% and Class A dropped 1.7% during that time. Prime rents are also significantly higher than Class A rents. From 2018 to the end of 2019, prime rent was on average 1.4 times that of Class A. This number has now reached 1.5 as of Q3 2023.

Prime Performance Relative to Broad Markets and Class A Properties
The current classification system of office properties is becoming obsolete, which is another reason EA developed this new prime data series. Class A properties in the top 16 markets account for 66% of total stock with that percentage ranging from 74% in Manhattan to 52% in Phoenix.
As of Q3 2023, prime buildings’ aggregated vacancy rate sits around 14.4%, significantly lower than the market level vacancy rate for these 16 markets, which is around 19.0%. Class A vacancy is even higher at 19.4% as of Q3 2023. Further, if prime buildings were removed from the Class A statistics, Class A vacancy would have eclipsed 20% in Q3 2023. In terms of change, both market and prime buildings increased by a similar amount, around 690 bps, from Q1 2020 to Q3 2023. Class A edged even higher with an increase of more than 750 bps.

Understanding Local Nuances
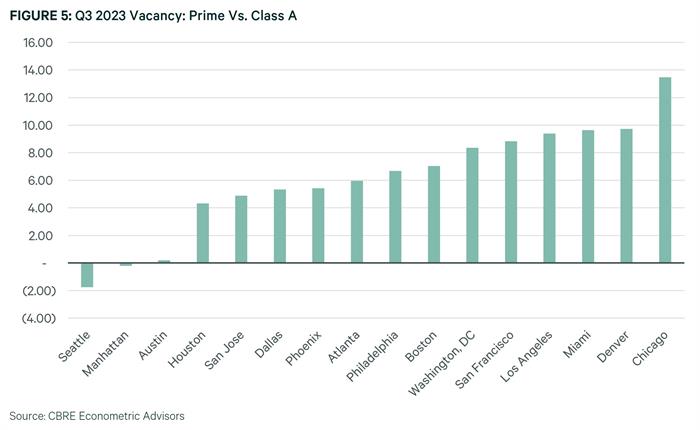
As office markets become more fragmented and localized, it’s more important than ever to understand the nuances of individual local markets and submarkets. Figure 5 shows the current vacancy rate gap between prime and its respective Class A market performance by market. Of all the 16 markets, only Seattle and Manhattan showed a negative gap and Austin’s prime vacancy is almost on par with its Class A vacancy rate. The varying performance within the prime sector highlights the importance of researchers understanding the unique characteristics of each local market.
For example, Austin is the top market in terms of completions in the past five years, with about 24% of stock being delivered since 2018. Strong supply works as a headwind when demand cannot keep up, dragging up the vacancy rate in those prime buildings, especially as many are still in lease-up. Seattle is also a market with strong supply gains in the past five years and is ranked No. 7 nationally in terms of average completion rate. However, along with the supply headwind, Seattle prime buildings’ exposure to tech companies is also dragging down its fundamentals. Manhattan’s prime vacancy rate, although in Q3 2023 a bit higher than Class A, only increased 420 bps from Q1 2020, whereas the Class A buildings’ vacancy increased more than 700 bps.
To demonstrate more of prime data, we investigate two markets below. In Manhattan, prime rent growth increased significantly since the onset of the pandemic, with 16% cumulative growth from Q1 2020 to Q3 2023. Before the pandemic, vacancy rates for prime offices were already high, driven by newly built assets in lease-up or partially occupied renovated buildings. However, the rise in prime office vacancies was significantly lower—about 420 bps compared to the broader market's 760 bps. Notably, while overall market vacancies surged, the direct vacancy rate for prime offices remained stable during this period.

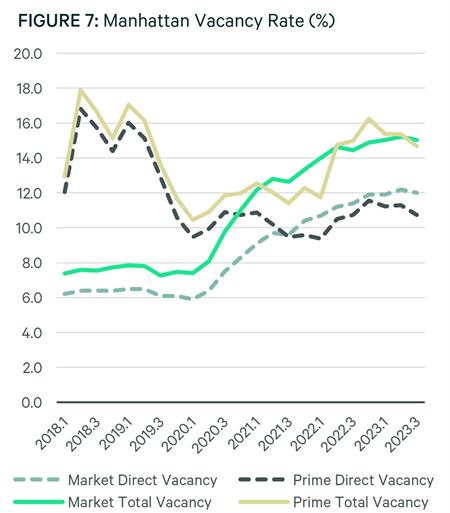
*Note: Total vacancy is the direct vacancy rate plus the sublet vacancy rate.
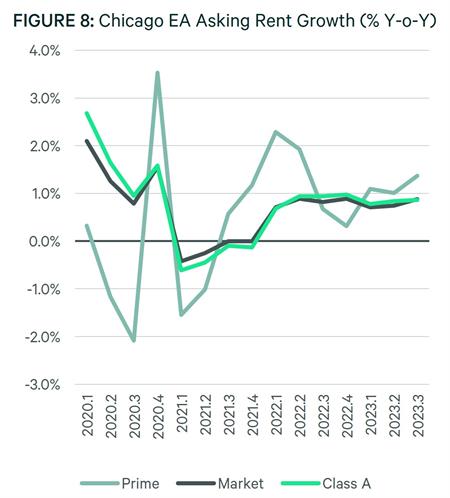
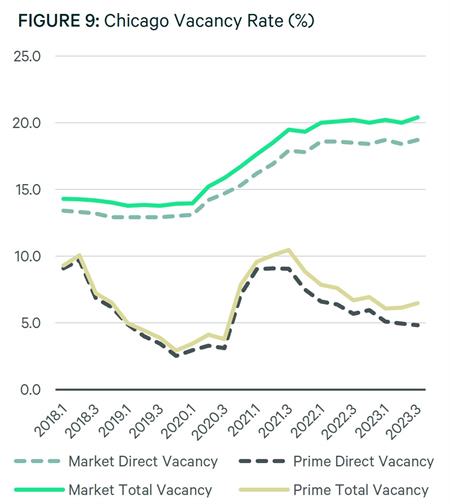
In Chicago, prime rent, Class A rent, and market rent all showed relatively stable growth. Prime rent grew 2.1% from Q1 2020 to Q3 2023, whereas market rent and Class A rent grew 1.5% and 1.4%, respectively. Vacancy showed more divergence, especially in terms of trajectory. Prime vacancy reached a peak in Q3 2021 and has been decreasing since then. As of Q3 2023, prime vacancy sits around 6.5% and is only up 300 bps from pre-pandemic levels. Market vacancy, however, kept increasing and stabilized around 20%. The gap between prime vacancy and market vacancy as of Q3 2023 reached 1,390 bps. The increase in the vacancy rate was also more pronounced at the market level. For example, total vacancy for the Chicago market increased more than 640 bps, more than double the prime vacancy increase. Direct vacancy followed total vacancy closely, meaning sublet vacancy did not show much of a movement either for prime buildings or the broader Chicago market.
Conclusion
As the flight to quality trend intensifies and more investors are now looking exclusively at this prime segment of the market, CBRE EA aims to provide the most updated information on this outperforming segment of the market with its new Prime Office data series. By segmenting the prime office sector, institutional investors who largely invest in trophy assets can better gauge how that niche tranche is truly performing in this volatile time and thus make better judgements and investment decisions. In the long run, we are predicting limited overall supply growth in the office sector given the negative sentiment and tight financial conditions. The limited supply will create more tailwinds for prime assets that are already in place or in the pipeline. We believe the haves and have-nots gap will continue to widen – a trend we will be closely monitoring in the coming years.
Appendix I
Appendix II
Class A Definition: In general, a Class A building is an extremely desirable investment-grade property with the highest quality construction and workmanship, materials and systems, significant architectural features, the highest quality finish and trim, abundant amenities, first rate maintenance and management; usually occupied by prestigious tenants with above average rental rates and in an excellent location with exceptional accessibility. They are most eagerly sought by international and national investors willing to pay a premium for quality and are often designed by architects whose names are immediately recognizable. A building meeting these criteria is often considered to be a landmark, either historical, architectural or both. If the building is older than 10 years, it has been renovated to maintain its status. Buildings of this stature may also have unique shape and floorplans and a definite market presence.
What's Next?
Watch Now: 2024 Outlook WebinarAccess the recording of our latest quarterly webinar held Thursday, December 14. |
Locator DataViews Training Guide
Interested in learning more about our Locator tool? Access the training guide and learn how to best leverage the tool. |
CBRE Insights & Research
The places in which we live, work and invest will continue to change and adapt to technology, demographics and human expectations at an accelerated rate. |


