/cbre_logo.png?sfvrsn=eac6e070_4)
A Multi-perspective View on Cap Rates
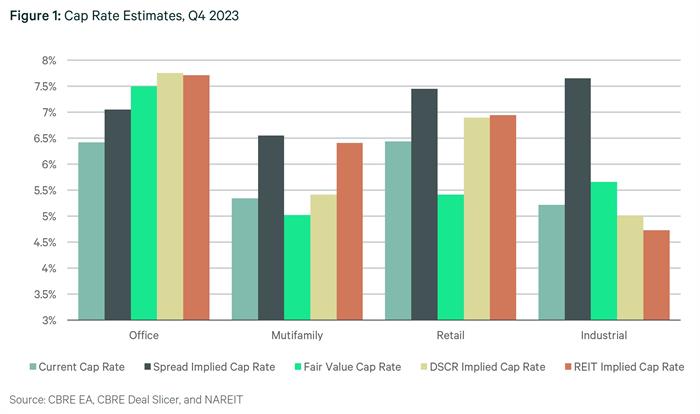
There are several ways the industry looks at capitalization rates (cap rates) for commercial properties. Comparing them considering the current generational shift in cap rates is helpful for understanding pricing. In this Viewpoint, we estimate what cap rates should be at the sector level using four different methods and compare these with our CBRE Econometric Advisors (CBRE EA) cap rates. Our examination of cap rates reveals that some property types are appropriately valued while others will likely see additional cap rate expansion.
CBRE EA produces current cap rates through our investment performance model based on data and input from capital markets experts. These are the product of NCREIF cap rate data, macroeconomic fundamentals, deal level data, and the CBRE Cap Rate Survey, which includes CBRE professionals’ estimates on current cap rates. Our most current cap rates are 5.2% (industrial), 5.3% (multifamily), 6.4% (office), and 6.4% (retail). This reflects the average for all markets covered by CBRE EA.
We use the following methods in our comparison.
- A popular way of estimating cap rates is to add the average historical spread of cap rates over the 10-year treasury to the current yield. In this piece, we use the average spread from 2010-2020, which was 230 (multifamily), 280 (office), 320 (retail), and 340 (industrial) basis points (bps). The current 10-year yield sits at 4.25% as of February 15, 2024. Using average spreads from this period may miss some of the structural shifts in demand since 2020, which could make these cap rate estimates too high (industrial) or low (office).
- Secondly, we use a fair value cap rate and leverage the Gordon Growth model. We use the two components of a cap rate, the discount rate (risk-free rate (10-year treasury) + risk-premium) minus the expected income growth rate. In this case, we use our average sector level risk-premiums from our CBRE EA Hurdle Rate model. For expected income growth, we use an estimated 10-year forward annualized NOI growth calculated as the unweighted average of EA markets.
- Next, we estimate a Debt Service Coverage Ratio (DSCR) implied cap rate. DSCR is operating income divided by debt-servicing costs. This is calculated by multiplying the all-in cost of debt (5-year swap rate + credit spread + amortization factor) by the LTV by the DSCR. For this Viewpoint, we use an amortization factor of 1.5%. For LTV, we use a loan level dataset from CBRE using the loan amount weighted 2023 average for each sector. CBRE debt experts provided credit spreads and DSCR as of January 5, 2024.
- Finally, we report REIT implied cap rate as reported by NAREIT (T-Tracker Q3 2023). This is calculated using the relationship between current REIT stock prices and expected income.


Our current industrial estimate of 5.2% also is below the fair value estimate of 5.7% and above the REIT implied rate of 4.7%. The spread-implied rate is significantly higher, although likely due to the average spread issue we discussed for the office sector, but in reverse, meaning investor demand for industrial has increased in recent years relative to 2010-2020.
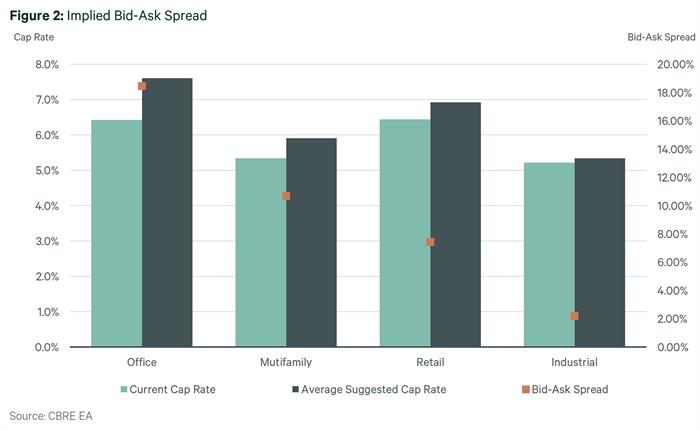
In Figure 2, we compare the current cap rate against the median of our four calculated cap rates. We use those two cap rate estimates to value a property with a $10 million annual NOI. We then report the percentage difference in these values as an implied bid-ask spread. The office sector has the largest spread over 18% while multifamily sits at 11%. The industrial and retail sectors’ lower bid-ask spreads suggest pricing is more appropriate.

In conclusion, we believe the recent cap rate expansion is close to its end. However, the office and multifamily sectors seem to have more room for further expansion based on these estimates. Retail and industrial seem to have more appropriate pricing now. Using multiple perspectives to analyze cap rates can be helpful during these volatile times. In future work, we hope to compare these methods across time. There may be important signals hidden in the relationship between different pricing methods.
- Christina Tong (34)
- Daniel Diebel (20)
- Dennis Schoenmaker (36)
- Franz Limoges (26)
- Jing Ren (20)
- Matt Mowell (190)
- Michael Leahy (35)
- Stefan Weiss (30)
- Tyler Mangin (8)
What's Next?
Watch Now: 2024 Outlook WebinarAccess the recording of our latest quarterly webinar held Thursday, December 14. |
Locator DataViews Training Guide
Interested in learning more about our Locator tool? Access the training guide and learn how to best leverage the tool. |
CBRE Insights & Research
The places in which we live, work and invest will continue to change and adapt to technology, demographics and human expectations at an accelerated rate. |


