/cbre_logo.png?sfvrsn=eac6e070_4)
Developers bet on increased resilience of New Orleans
It’s been nearly 19 years since Hurricane Katrina devastated New Orleans. Since then, the Army Corps of Engineers has spent nearly $15 billion to mitigate flood risk, which has emboldened developers to complete 50 million sq. ft. of new construction.
Just how confident are developers that a Katrina-like catastrophe won’t recur?
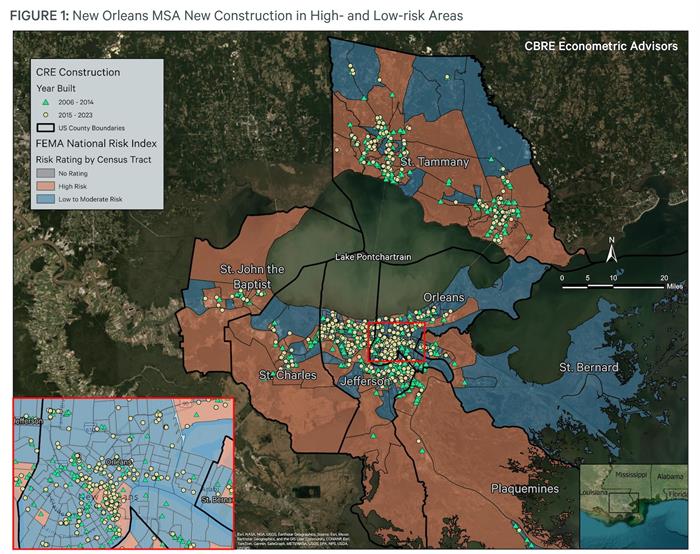
Our map provides answers. We shaded the New Orleans MSA’s census tracts on the Federal Emergency Management Agency’s (FEMA) definition of high and low physical risk.
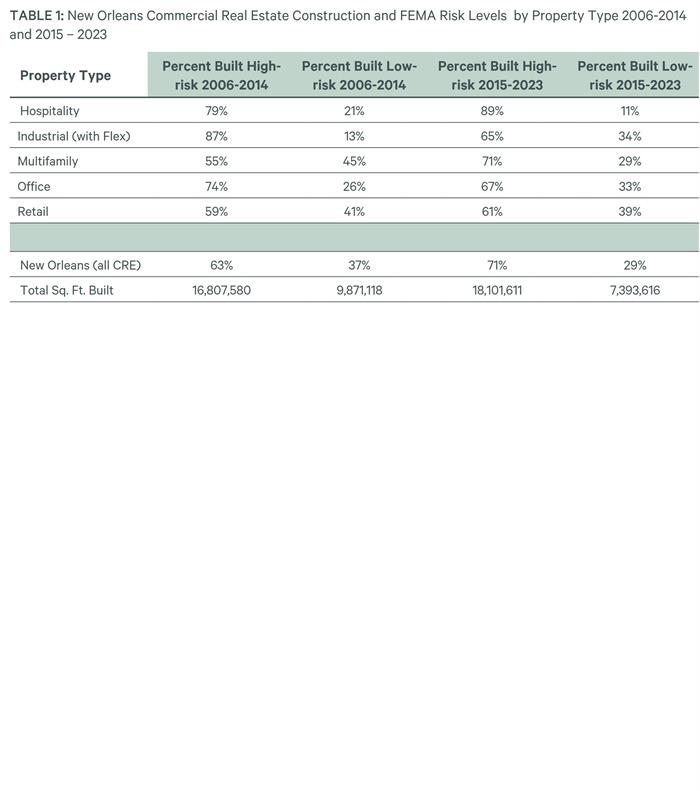
In the first nine years after Katrina (2006-2014), the 60% of greater New Orleans that FEMA classifies as high-risk received 63% of the new construction activity. Since 2015, the percentage has jumped to 71%.
Multifamily developers have behaved most boldly as construction in high-risk tracts increased by 16 percentage points (from 55% to 71%) between the 2006-2014 and 2015-2023 periods. Much of the new construction was concentrated in high-risk tracts in downtown New Orleans and suburbs like Covington and Slidell.
Conversely, industrial development has trended away from high-risk areas, falling from 87% in 2006-2014 to 65% in 2015-2023. Most of the industrial construction has taken place outside the CBD in areas like Almedia and Elmwood.
Among other property sectors, hospitality and retail saw increases in high-risk-area development of 10 percentage points and 2 percentage points, respectively, while such development fell 7 percentage points for office.
These construction patterns suggest developers have confidence in the increased resilience of New Orleans’s infrastructure.


What's Next?
Watch Now: 2024 Outlook WebinarAccess the recording of our latest quarterly webinar held Thursday, December 14. |
Locator DataViews Training Guide
Interested in learning more about our Locator tool? Access the training guide and learn how to best leverage the tool. |
CBRE Insights & Research
The places in which we live, work and invest will continue to change and adapt to technology, demographics and human expectations at an accelerated rate. |


