/cbre_logo.png?sfvrsn=eac6e070_4)
A Rising Tide Will Not Lift All Office Properties
When it comes to office vacancy rates, averages can be misleading. A portfolio of five properties that are each 19% vacant will have the same mean vacancy rate as a portfolio with four fully occupied properties and one that is 95% vacant.
We expect the office vacancy rate average will peak at the current 19% level. However, the recovery will not benefit all properties equally. A continued flight to quality as leases expire won’t necessarily affect the average vacancy rate but will be a substantial drag on the performance of lower-quality assets.
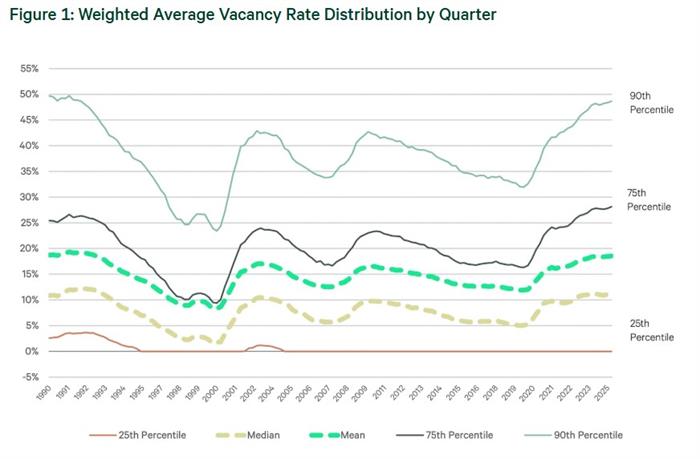
Figure 1 shows the distribution of vacancy rates across office properties, utilizing mean, median, and percentile values (weighted by square footage). Properties with the highest vacancy rate have seen much more significant increases in vacancy than the average property.
- Median (50th Percentile): Since Q4 2019, the median vacancy rate has increased from 5.1% to 11% as of Q1 2025. This indicates a general softening across the market.
- Bottom 25% Properties: The 75th percentile (representing the vacancy rate required to be in the 25% most vacant properties) has risen from 16.7% to 28.1% over the same period. This highlights the increasing challenges faced by properties in the lower quartile.
- Top 25% Properties: Properties in the top 25th percentile have generally maintained full occupancy, demonstrating the resilience of higher-quality assets.
- 10% Most Vacant Properties: The 10% properties with the most vacant space now have a vacancy rate of at least 48.7%, significantly more than the 32% level in Q4 2019.
- Unweighted Data: When analyzing the data on an unweighted basis, the average vacancy rate is just 13.2%, significantly lower than the square-foot weighted average of 19%. This suggests that vacancy is disproportionately concentrated within larger properties.
Despite our belief that office vacancy has peaked, owners of commodity buildings will likely need to execute repositioning or conversion strategies to unlock value. As leases from 2019 and earlier come up for renewal, owners of these assets will likely lose some tenants to higher grade properties. While the tide may be rising, icebergs abound.

What's Next?
Watch Now: 2024 Outlook WebinarAccess the recording of our latest quarterly webinar held Thursday, December 14. |
Locator DataViews Training Guide
Interested in learning more about our Locator tool? Access the training guide and learn how to best leverage the tool. |
CBRE Insights & Research
The places in which we live, work and invest will continue to change and adapt to technology, demographics and human expectations at an accelerated rate. |


